
Advertisement
- Australia
- /
- Life Sciences
- /
- ASX:GSS
Even With A 26% Surge, Cautious Investors Are Not Rewarding Genetic Signatures Limited's (ASX:GSS) Performance Completely
Those holding Genetic Signatures Limited (ASX:GSS) shares would be relieved that the share price has rebounded 26% in the last thirty days, but it needs to keep going to repair the recent damage it has caused to investor portfolios. But the last month did very little to improve the 56% share price decline over the last year.
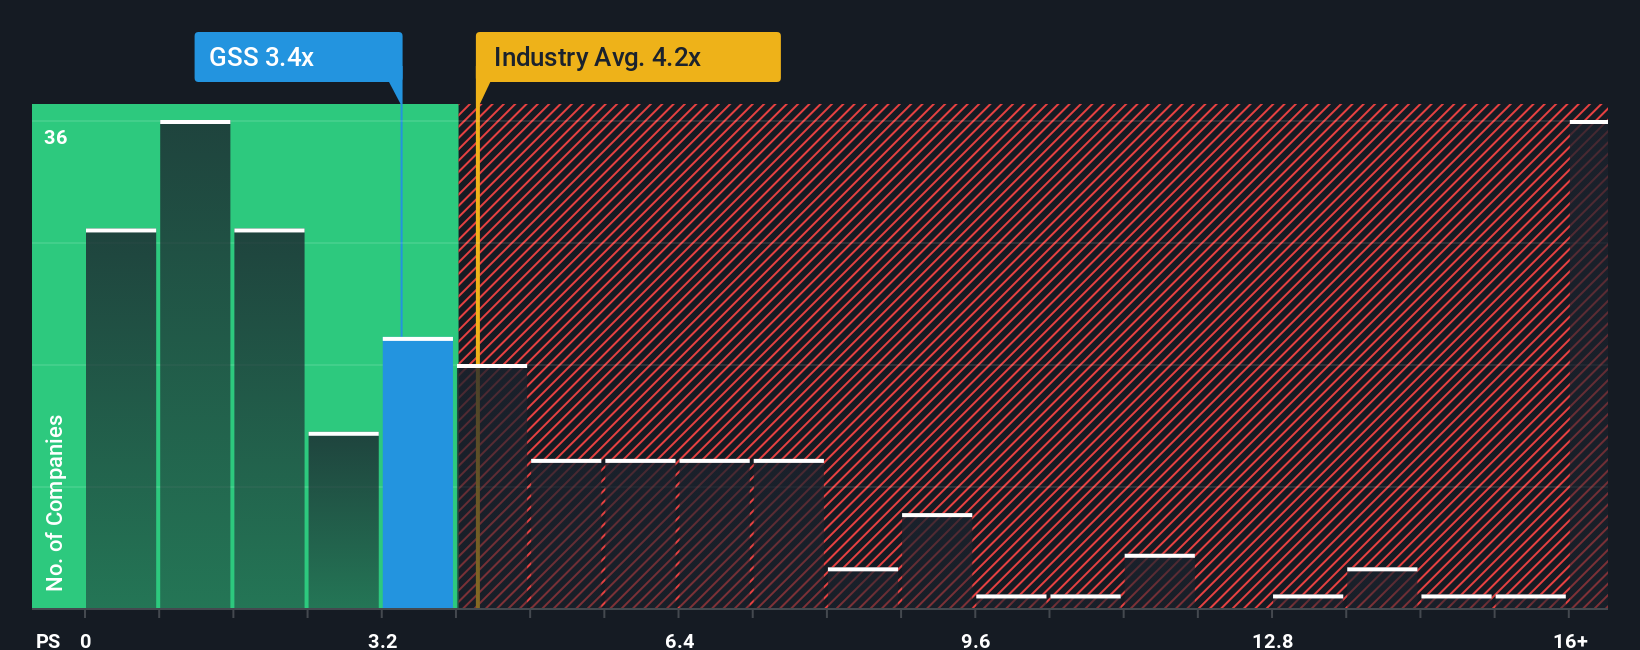
Even after such a large jump in price, Genetic Signatures may still be sending very bullish signals at the moment with its price-to-sales (or "P/S") ratio of 3.4x, since almost half of all companies in the Life Sciences industry in Australia have P/S ratios greater than 10.1x and even P/S higher than 18x are not unusual. Although, it's not wise to just take the P/S at face value as there may be an explanation why it's so limited.
Check out our latest analysis for Genetic Signatures
How Genetic Signatures Has Been Performing
With revenue growth that's superior to most other companies of late, Genetic Signatures has been doing relatively well. One possibility is that the P/S ratio is low because investors think this strong revenue performance might be less impressive moving forward. If not, then existing shareholders have reason to be quite optimistic about the future direction of the share price.
Keen to find out how analysts think Genetic Signatures' future stacks up against the industry? In that case, our free report is a great place to start.What Are Revenue Growth Metrics Telling Us About The Low P/S?
There's an inherent assumption that a company should far underperform the industry for P/S ratios like Genetic Signatures' to be considered reasonable.
If we review the last year of revenue growth, the company posted a terrific increase of 43%. Still, revenue has fallen 44% in total from three years ago, which is quite disappointing. Accordingly, shareholders would have felt downbeat about the medium-term rates of revenue growth.
Turning to the outlook, the next three years should generate growth of 33% per annum as estimated by the two analysts watching the company. That's shaping up to be materially higher than the 8.8% per annum growth forecast for the broader industry.
With this in consideration, we find it intriguing that Genetic Signatures' P/S sits behind most of its industry peers. It looks like most investors are not convinced at all that the company can achieve future growth expectations.
The Key Takeaway
Genetic Signatures' recent share price jump still sees fails to bring its P/S alongside the industry median. Using the price-to-sales ratio alone to determine if you should sell your stock isn't sensible, however it can be a practical guide to the company's future prospects.
To us, it seems Genetic Signatures currently trades on a significantly depressed P/S given its forecasted revenue growth is higher than the rest of its industry. There could be some major risk factors that are placing downward pressure on the P/S ratio. It appears the market could be anticipating revenue instability, because these conditions should normally provide a boost to the share price.
We don't want to rain on the parade too much, but we did also find 3 warning signs for Genetic Signatures that you need to be mindful of.
If companies with solid past earnings growth is up your alley, you may wish to see this free collection of other companies with strong earnings growth and low P/E ratios.
New: Manage All Your Stock Portfolios in One Place
We've created the ultimate portfolio companion for stock investors, and it's free.
• Connect an unlimited number of Portfolios and see your total in one currency
• Be alerted to new Warning Signs or Risks via email or mobile
• Track the Fair Value of your stocks
Have feedback on this article? Concerned about the content? Get in touch with us directly. Alternatively, email editorial-team (at) simplywallst.com.
This article by Simply Wall St is general in nature. We provide commentary based on historical data and analyst forecasts only using an unbiased methodology and our articles are not intended to be financial advice. It does not constitute a recommendation to buy or sell any stock, and does not take account of your objectives, or your financial situation. We aim to bring you long-term focused analysis driven by fundamental data. Note that our analysis may not factor in the latest price-sensitive company announcements or qualitative material. Simply Wall St has no position in any stocks mentioned.
About ASX:GSS
Genetic Signatures
Operates as a molecular diagnostic company in Australia, the Asia Pacific, Europe, the Middle East, Asia, and the Americas.
Flawless balance sheet and fair value.
Similar Companies
Market Insights

Advertisement
Community Narratives
The company that turned a verb into a global necessity and basically runs the modern internet, digital ads, smartphones, maps, and AI.
Fair Value US$300.00|7.1% undervalued
OS
Community Contributor
Flowers Foods Pays A Fair Price For Health
Fair Value US$16.12|26.4% undervalued
NV
Community Contributor
TMX Group will thrive with 33.3% profit margin and enduring market moat
Fair Value CA$49.90|0.8% overvalued
LI
Community Contributor
The "Molecular Pencil": Why Beam's Technology is Built to Win
Fair Value US$65.01|65.8% undervalued
DA
Community Contributor