Stock Analysis
- Australia
- /
- Metals and Mining
- /
- ASX:SBM
Even after rising 12% this past week, St Barbara (ASX:SBM) shareholders are still down 85% over the past five years


Over the last month the St Barbara Limited (ASX:SBM) has been much stronger than before, rebounding by 31%. But that doesn't change the fact that the returns over the last half decade have been stomach churning. Indeed, the share price is down a whopping 94% in that time. The recent bounce might mean the long decline is over, but we are not confident. The fundamental business performance will ultimately determine if the turnaround can be sustained. While a drop like that is definitely a body blow, money isn't as important as health and happiness.
Although the past week has been more reassuring for shareholders, they're still in the red over the last five years, so let's see if the underlying business has been responsible for the decline.
View our latest analysis for St Barbara
Because St Barbara made a loss in the last twelve months, we think the market is probably more focussed on revenue and revenue growth, at least for now. Shareholders of unprofitable companies usually desire strong revenue growth. That's because it's hard to be confident a company will be sustainable if revenue growth is negligible, and it never makes a profit.
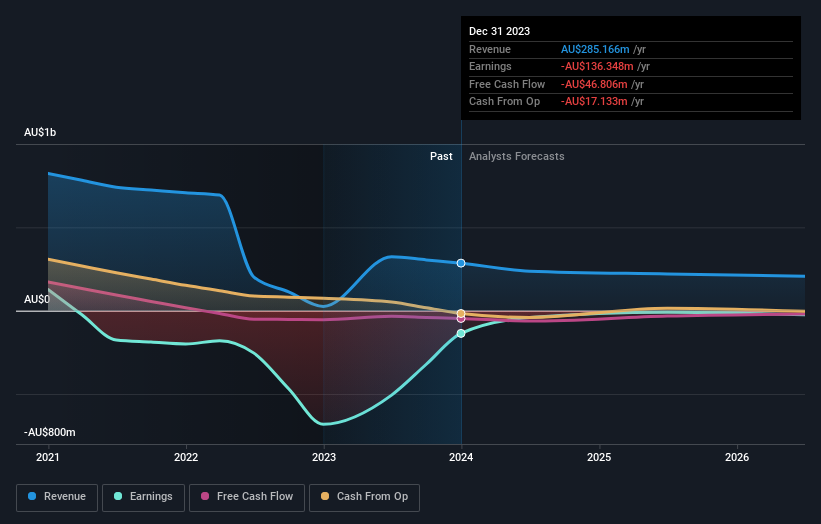
In the last five years St Barbara saw its revenue shrink by 20% per year. That puts it in an unattractive cohort, to put it mildly. So it's not altogether surprising to see the share price down 14% per year in the same time period. This kind of price performance makes us very wary, especially when combined with falling revenue. Of course, the poor performance could mean the market has been too severe selling down. That can happen.
You can see how earnings and revenue have changed over time in the image below (click on the chart to see the exact values).
This free interactive report on St Barbara's balance sheet strength is a great place to start, if you want to investigate the stock further.
What About The Total Shareholder Return (TSR)?
We've already covered St Barbara's share price action, but we should also mention its total shareholder return (TSR). The TSR attempts to capture the value of dividends (as if they were reinvested) as well as any spin-offs or discounted capital raisings offered to shareholders. Its history of dividend payouts mean that St Barbara's TSR, which was a 85% drop over the last 5 years, was not as bad as the share price return.
A Different Perspective
St Barbara shareholders are down 32% for the year, but the market itself is up 15%. Even the share prices of good stocks drop sometimes, but we want to see improvements in the fundamental metrics of a business, before getting too interested. Unfortunately, last year's performance may indicate unresolved challenges, given that it was worse than the annualised loss of 13% over the last half decade. We realise that Baron Rothschild has said investors should "buy when there is blood on the streets", but we caution that investors should first be sure they are buying a high quality business. It's always interesting to track share price performance over the longer term. But to understand St Barbara better, we need to consider many other factors. For instance, we've identified 1 warning sign for St Barbara that you should be aware of.
Of course St Barbara may not be the best stock to buy. So you may wish to see this free collection of growth stocks.
Please note, the market returns quoted in this article reflect the market weighted average returns of stocks that currently trade on Australian exchanges.
Valuation is complex, but we're helping make it simple.
Find out whether St Barbara is potentially over or undervalued by checking out our comprehensive analysis, which includes fair value estimates, risks and warnings, dividends, insider transactions and financial health.
View the Free AnalysisHave feedback on this article? Concerned about the content? Get in touch with us directly. Alternatively, email editorial-team (at) simplywallst.com.
This article by Simply Wall St is general in nature. We provide commentary based on historical data and analyst forecasts only using an unbiased methodology and our articles are not intended to be financial advice. It does not constitute a recommendation to buy or sell any stock, and does not take account of your objectives, or your financial situation. We aim to bring you long-term focused analysis driven by fundamental data. Note that our analysis may not factor in the latest price-sensitive company announcements or qualitative material. Simply Wall St has no position in any stocks mentioned.
About ASX:SBM
St Barbara
Engages in the exploration, development, mining, and sale of gold.
Excellent balance sheet and slightly overvalued.
