- Australia
- /
- Metals and Mining
- /
- ASX:PLS
Pilbara Minerals Limited's (ASX:PLS) Stock Has Been Sliding But Fundamentals Look Strong: Is The Market Wrong?


It is hard to get excited after looking at Pilbara Minerals' (ASX:PLS) recent performance, when its stock has declined 13% over the past three months. But if you pay close attention, you might gather that its strong financials could mean that the stock could potentially see an increase in value in the long-term, given how markets usually reward companies with good financial health. Particularly, we will be paying attention to Pilbara Minerals' ROE today.
Return on equity or ROE is an important factor to be considered by a shareholder because it tells them how effectively their capital is being reinvested. In simpler terms, it measures the profitability of a company in relation to shareholder's equity.
View our latest analysis for Pilbara Minerals
How Do You Calculate Return On Equity?
The formula for return on equity is:
Return on Equity = Net Profit (from continuing operations) ÷ Shareholders' Equity
So, based on the above formula, the ROE for Pilbara Minerals is:
43% = AU$1.4b ÷ AU$3.2b (Based on the trailing twelve months to December 2023).
The 'return' is the amount earned after tax over the last twelve months. One way to conceptualize this is that for each A$1 of shareholders' capital it has, the company made A$0.43 in profit.
What Is The Relationship Between ROE And Earnings Growth?
We have already established that ROE serves as an efficient profit-generating gauge for a company's future earnings. Based on how much of its profits the company chooses to reinvest or "retain", we are then able to evaluate a company's future ability to generate profits. Assuming all else is equal, companies that have both a higher return on equity and higher profit retention are usually the ones that have a higher growth rate when compared to companies that don't have the same features.
Pilbara Minerals' Earnings Growth And 43% ROE
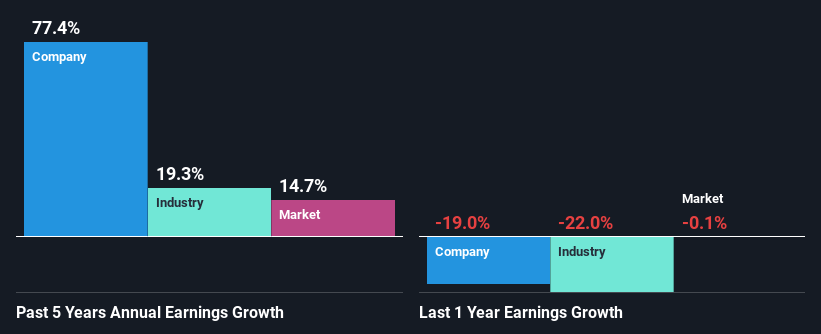
To begin with, Pilbara Minerals has a pretty high ROE which is interesting. Secondly, even when compared to the industry average of 10% the company's ROE is quite impressive. As a result, Pilbara Minerals' exceptional 77% net income growth seen over the past five years, doesn't come as a surprise.
We then compared Pilbara Minerals' net income growth with the industry and we're pleased to see that the company's growth figure is higher when compared with the industry which has a growth rate of 19% in the same 5-year period.
Earnings growth is an important metric to consider when valuing a stock. It’s important for an investor to know whether the market has priced in the company's expected earnings growth (or decline). By doing so, they will have an idea if the stock is headed into clear blue waters or if swampy waters await. What is PLS worth today? The intrinsic value infographic in our free research report helps visualize whether PLS is currently mispriced by the market.
Is Pilbara Minerals Making Efficient Use Of Its Profits?
While the company did pay out a portion of its dividend in the past, it currently doesn't pay a regular dividend. This is likely what's driving the high earnings growth number discussed above.
Summary
On the whole, we feel that Pilbara Minerals' performance has been quite good. In particular, it's great to see that the company is investing heavily into its business and along with a high rate of return, that has resulted in a sizeable growth in its earnings. That being so, according to the latest industry analyst forecasts, the company's earnings are expected to shrink in the future. Are these analysts expectations based on the broad expectations for the industry, or on the company's fundamentals? Click here to be taken to our analyst's forecasts page for the company.
New: Manage All Your Stock Portfolios in One Place
We've created the ultimate portfolio companion for stock investors, and it's free.
• Connect an unlimited number of Portfolios and see your total in one currency
• Be alerted to new Warning Signs or Risks via email or mobile
• Track the Fair Value of your stocks
Have feedback on this article? Concerned about the content? Get in touch with us directly. Alternatively, email editorial-team (at) simplywallst.com.
This article by Simply Wall St is general in nature. We provide commentary based on historical data and analyst forecasts only using an unbiased methodology and our articles are not intended to be financial advice. It does not constitute a recommendation to buy or sell any stock, and does not take account of your objectives, or your financial situation. We aim to bring you long-term focused analysis driven by fundamental data. Note that our analysis may not factor in the latest price-sensitive company announcements or qualitative material. Simply Wall St has no position in any stocks mentioned.
About ASX:PLS
Pilbara Minerals
Engages in the exploration, development, and operation of mineral resources in Australia.
Excellent balance sheet with reasonable growth potential.

