- Australia
- /
- Capital Markets
- /
- ASX:SEQ
Sequoia Financial Group (ASX:SEQ) delivers shareholders splendid 17% CAGR over 5 years, surging 13% in the last week alone


When we invest, we're generally looking for stocks that outperform the market average. And the truth is, you can make significant gains if you buy good quality businesses at the right price. To wit, the Sequoia Financial Group share price has climbed 87% in five years, easily topping the market return of 20% (ignoring dividends). On the other hand, the more recent gains haven't been so impressive, with shareholders gaining just 13% , including dividends .
Since it's been a strong week for Sequoia Financial Group shareholders, let's have a look at trend of the longer term fundamentals.
See our latest analysis for Sequoia Financial Group
To quote Buffett, 'Ships will sail around the world but the Flat Earth Society will flourish. There will continue to be wide discrepancies between price and value in the marketplace...' One imperfect but simple way to consider how the market perception of a company has shifted is to compare the change in the earnings per share (EPS) with the share price movement.
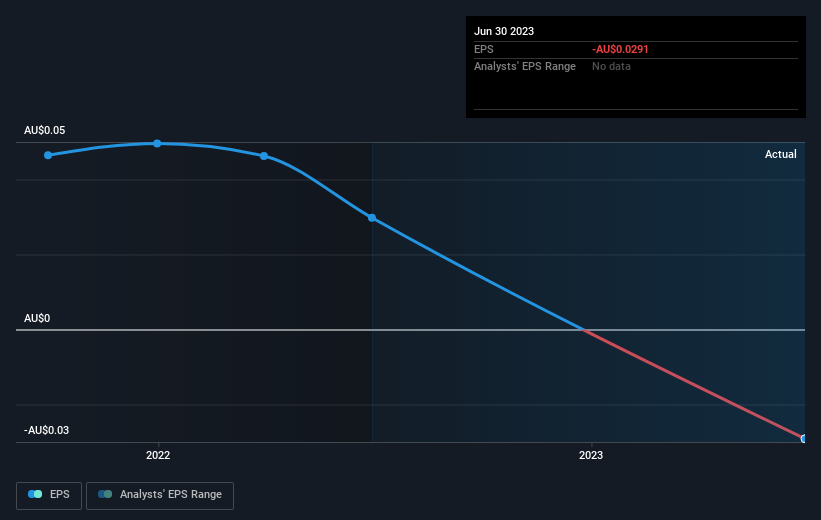
Over half a decade, Sequoia Financial Group managed to grow its earnings per share at 18% a year. The EPS growth is more impressive than the yearly share price gain of 13% over the same period. So one could conclude that the broader market has become more cautious towards the stock.
The image below shows how EPS has tracked over time (if you click on the image you can see greater detail).
Dive deeper into Sequoia Financial Group's key metrics by checking this interactive graph of Sequoia Financial Group's earnings, revenue and cash flow.
What About The Total Shareholder Return (TSR)?
We've already covered Sequoia Financial Group's share price action, but we should also mention its total shareholder return (TSR). The TSR is a return calculation that accounts for the value of cash dividends (assuming that any dividend received was reinvested) and the calculated value of any discounted capital raisings and spin-offs. Its history of dividend payouts mean that Sequoia Financial Group's TSR of 116% over the last 5 years is better than the share price return.
A Different Perspective
It's nice to see that Sequoia Financial Group shareholders have received a total shareholder return of 13% over the last year. However, that falls short of the 17% TSR per annum it has made for shareholders, each year, over five years. It's always interesting to track share price performance over the longer term. But to understand Sequoia Financial Group better, we need to consider many other factors. Even so, be aware that Sequoia Financial Group is showing 1 warning sign in our investment analysis , you should know about...
If you are like me, then you will not want to miss this free list of growing companies that insiders are buying.
Please note, the market returns quoted in this article reflect the market weighted average returns of stocks that currently trade on Australian exchanges.
New: Manage All Your Stock Portfolios in One Place
We've created the ultimate portfolio companion for stock investors, and it's free.
• Connect an unlimited number of Portfolios and see your total in one currency
• Be alerted to new Warning Signs or Risks via email or mobile
• Track the Fair Value of your stocks
Have feedback on this article? Concerned about the content? Get in touch with us directly. Alternatively, email editorial-team (at) simplywallst.com.
This article by Simply Wall St is general in nature. We provide commentary based on historical data and analyst forecasts only using an unbiased methodology and our articles are not intended to be financial advice. It does not constitute a recommendation to buy or sell any stock, and does not take account of your objectives, or your financial situation. We aim to bring you long-term focused analysis driven by fundamental data. Note that our analysis may not factor in the latest price-sensitive company announcements or qualitative material. Simply Wall St has no position in any stocks mentioned.
About ASX:SEQ
Sequoia Financial Group
An integrated financial services company, provides financial products and services to retail and wholesale clients, and third-party professional service firms primarily in Australia.
Flawless balance sheet slight.
