- Australia
- /
- Professional Services
- /
- ASX:MMS
Even though McMillan Shakespeare (ASX:MMS) has lost AU$77m market cap in last 7 days, shareholders are still up 119% over 3 years


By buying an index fund, investors can approximate the average market return. But many of us dare to dream of bigger returns, and build a portfolio ourselves. For example, McMillan Shakespeare Limited (ASX:MMS) shareholders have seen the share price rise 75% over three years, well in excess of the market return (12%, not including dividends). However, more recent returns haven't been as impressive as that, with the stock returning just 58% in the last year , including dividends .
Since the long term performance has been good but there's been a recent pullback of 5.0%, let's check if the fundamentals match the share price.
See our latest analysis for McMillan Shakespeare
There is no denying that markets are sometimes efficient, but prices do not always reflect underlying business performance. By comparing earnings per share (EPS) and share price changes over time, we can get a feel for how investor attitudes to a company have morphed over time.
McMillan Shakespeare became profitable within the last three years. So we would expect a higher share price over the period.
The company's earnings per share (over time) is depicted in the image below (click to see the exact numbers).
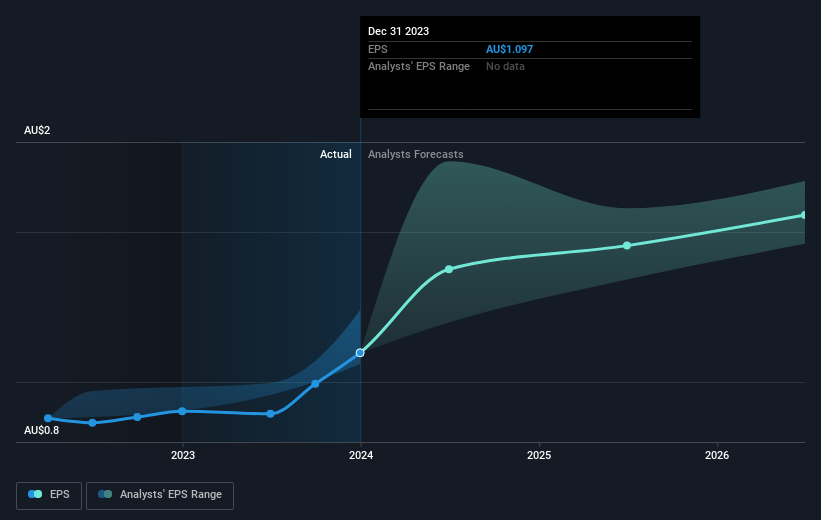
We know that McMillan Shakespeare has improved its bottom line over the last three years, but what does the future have in store? If you are thinking of buying or selling McMillan Shakespeare stock, you should check out this FREE detailed report on its balance sheet.
What About Dividends?
When looking at investment returns, it is important to consider the difference between total shareholder return (TSR) and share price return. The TSR incorporates the value of any spin-offs or discounted capital raisings, along with any dividends, based on the assumption that the dividends are reinvested. So for companies that pay a generous dividend, the TSR is often a lot higher than the share price return. We note that for McMillan Shakespeare the TSR over the last 3 years was 119%, which is better than the share price return mentioned above. This is largely a result of its dividend payments!
A Different Perspective
It's nice to see that McMillan Shakespeare shareholders have received a total shareholder return of 58% over the last year. That's including the dividend. That's better than the annualised return of 17% over half a decade, implying that the company is doing better recently. Given the share price momentum remains strong, it might be worth taking a closer look at the stock, lest you miss an opportunity. It's always interesting to track share price performance over the longer term. But to understand McMillan Shakespeare better, we need to consider many other factors. For instance, we've identified 3 warning signs for McMillan Shakespeare that you should be aware of.
We will like McMillan Shakespeare better if we see some big insider buys. While we wait, check out this free list of growing companies with considerable, recent, insider buying.
Please note, the market returns quoted in this article reflect the market weighted average returns of stocks that currently trade on Australian exchanges.
New: Manage All Your Stock Portfolios in One Place
We've created the ultimate portfolio companion for stock investors, and it's free.
• Connect an unlimited number of Portfolios and see your total in one currency
• Be alerted to new Warning Signs or Risks via email or mobile
• Track the Fair Value of your stocks
Have feedback on this article? Concerned about the content? Get in touch with us directly. Alternatively, email editorial-team (at) simplywallst.com.
This article by Simply Wall St is general in nature. We provide commentary based on historical data and analyst forecasts only using an unbiased methodology and our articles are not intended to be financial advice. It does not constitute a recommendation to buy or sell any stock, and does not take account of your objectives, or your financial situation. We aim to bring you long-term focused analysis driven by fundamental data. Note that our analysis may not factor in the latest price-sensitive company announcements or qualitative material. Simply Wall St has no position in any stocks mentioned.
About ASX:MMS
McMillan Shakespeare
Provides salary packaging, novated leasing, disability plan management, support co-ordination, asset management, and related financial products and services in Australia and New Zealand.
Very undervalued with proven track record.

