
Advertisement
- Australia
- /
- Trade Distributors
- /
- ASX:SGI
Does Stealth Group Holdings (ASX:SGI) Have A Healthy Balance Sheet?
Legendary fund manager Li Lu (who Charlie Munger backed) once said, 'The biggest investment risk is not the volatility of prices, but whether you will suffer a permanent loss of capital.' It's only natural to consider a company's balance sheet when you examine how risky it is, since debt is often involved when a business collapses. Importantly, Stealth Group Holdings Ltd (ASX:SGI) does carry debt. But the more important question is: how much risk is that debt creating?
What Risk Does Debt Bring?
Generally speaking, debt only becomes a real problem when a company can't easily pay it off, either by raising capital or with its own cash flow. In the worst case scenario, a company can go bankrupt if it cannot pay its creditors. While that is not too common, we often do see indebted companies permanently diluting shareholders because lenders force them to raise capital at a distressed price. By replacing dilution, though, debt can be an extremely good tool for businesses that need capital to invest in growth at high rates of return. The first step when considering a company's debt levels is to consider its cash and debt together.
See our latest analysis for Stealth Group Holdings
How Much Debt Does Stealth Group Holdings Carry?
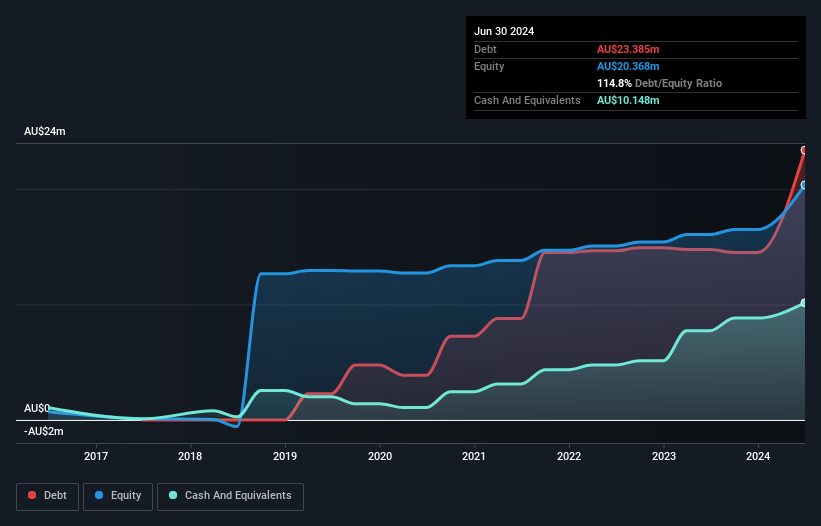
You can click the graphic below for the historical numbers, but it shows that as of June 2024 Stealth Group Holdings had AU$23.4m of debt, an increase on AU$14.8m, over one year. However, it does have AU$10.1m in cash offsetting this, leading to net debt of about AU$13.2m.
How Strong Is Stealth Group Holdings' Balance Sheet?
The latest balance sheet data shows that Stealth Group Holdings had liabilities of AU$51.3m due within a year, and liabilities of AU$13.5m falling due after that. Offsetting these obligations, it had cash of AU$10.1m as well as receivables valued at AU$19.2m due within 12 months. So its liabilities outweigh the sum of its cash and (near-term) receivables by AU$35.5m.
When you consider that this deficiency exceeds the company's AU$34.6m market capitalization, you might well be inclined to review the balance sheet intently. Hypothetically, extremely heavy dilution would be required if the company were forced to pay down its liabilities by raising capital at the current share price.
We use two main ratios to inform us about debt levels relative to earnings. The first is net debt divided by earnings before interest, tax, depreciation, and amortization (EBITDA), while the second is how many times its earnings before interest and tax (EBIT) covers its interest expense (or its interest cover, for short). The advantage of this approach is that we take into account both the absolute quantum of debt (with net debt to EBITDA) and the actual interest expenses associated with that debt (with its interest cover ratio).
Stealth Group Holdings has a debt to EBITDA ratio of 3.0 and its EBIT covered its interest expense 2.6 times. This suggests that while the debt levels are significant, we'd stop short of calling them problematic. Looking on the bright side, Stealth Group Holdings boosted its EBIT by a silky 41% in the last year. Like a mother's loving embrace of a newborn that sort of growth builds resilience, putting the company in a stronger position to manage its debt. There's no doubt that we learn most about debt from the balance sheet. But it is Stealth Group Holdings's earnings that will influence how the balance sheet holds up in the future. So if you're keen to discover more about its earnings, it might be worth checking out this graph of its long term earnings trend.
But our final consideration is also important, because a company cannot pay debt with paper profits; it needs cold hard cash. So the logical step is to look at the proportion of that EBIT that is matched by actual free cash flow. Over the last three years, Stealth Group Holdings actually produced more free cash flow than EBIT. There's nothing better than incoming cash when it comes to staying in your lenders' good graces.
Our View
Stealth Group Holdings's conversion of EBIT to free cash flow was a real positive on this analysis, as was its EBIT growth rate. In contrast, our confidence was undermined by its apparent struggle to cover its interest expense with its EBIT. Looking at all this data makes us feel a little cautious about Stealth Group Holdings's debt levels. While we appreciate debt can enhance returns on equity, we'd suggest that shareholders keep close watch on its debt levels, lest they increase. There's no doubt that we learn most about debt from the balance sheet. But ultimately, every company can contain risks that exist outside of the balance sheet. Case in point: We've spotted 3 warning signs for Stealth Group Holdings you should be aware of, and 1 of them shouldn't be ignored.
At the end of the day, it's often better to focus on companies that are free from net debt. You can access our special list of such companies (all with a track record of profit growth). It's free.
New: Manage All Your Stock Portfolios in One Place
We've created the ultimate portfolio companion for stock investors, and it's free.
• Connect an unlimited number of Portfolios and see your total in one currency
• Be alerted to new Warning Signs or Risks via email or mobile
• Track the Fair Value of your stocks
Have feedback on this article? Concerned about the content? Get in touch with us directly. Alternatively, email editorial-team (at) simplywallst.com.
This article by Simply Wall St is general in nature. We provide commentary based on historical data and analyst forecasts only using an unbiased methodology and our articles are not intended to be financial advice. It does not constitute a recommendation to buy or sell any stock, and does not take account of your objectives, or your financial situation. We aim to bring you long-term focused analysis driven by fundamental data. Note that our analysis may not factor in the latest price-sensitive company announcements or qualitative material. Simply Wall St has no position in any stocks mentioned.
About ASX:SGI
Stealth Group Holdings
Operates as an industrial distribution company in Australia and internationally.
Exceptional growth potential with solid track record.
Similar Companies
Market Insights

Advertisement
Community Narratives
The company that turned a verb into a global necessity and basically runs the modern internet, digital ads, smartphones, maps, and AI.
Fair Value US$300.00|8.0% undervalued
OS
Community Contributor
Flowers Foods Pays A Fair Price For Health
Fair Value US$16.12|26.4% undervalued
NV
Community Contributor
TMX Group will thrive with 33.3% profit margin and enduring market moat
Fair Value CA$49.90|0.8% overvalued
LI
Community Contributor
The "Molecular Pencil": Why Beam's Technology is Built to Win
Fair Value US$65.01|65.8% undervalued
DA
Community Contributor