Stock Analysis
BAWAG Group (VIE:BG) shareholders have earned a 10% CAGR over the last five years

Generally speaking the aim of active stock picking is to find companies that provide returns that are superior to the market average. And the truth is, you can make significant gains if you buy good quality businesses at the right price. For example, long term BAWAG Group AG (VIE:BG) shareholders have enjoyed a 21% share price rise over the last half decade, well in excess of the market return of around 16% (not including dividends).
With that in mind, it's worth seeing if the company's underlying fundamentals have been the driver of long term performance, or if there are some discrepancies.
See our latest analysis for BAWAG Group
To quote Buffett, 'Ships will sail around the world but the Flat Earth Society will flourish. There will continue to be wide discrepancies between price and value in the marketplace...' By comparing earnings per share (EPS) and share price changes over time, we can get a feel for how investor attitudes to a company have morphed over time.
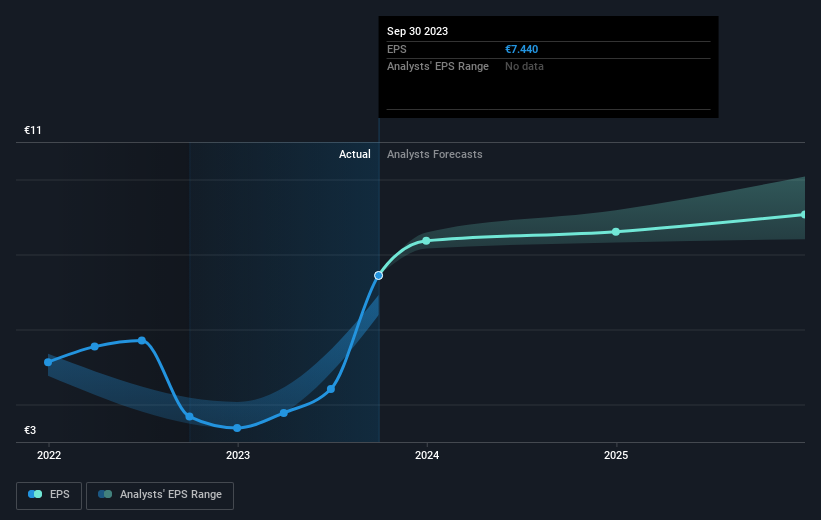
During five years of share price growth, BAWAG Group achieved compound earnings per share (EPS) growth of 9.5% per year. The EPS growth is more impressive than the yearly share price gain of 4% over the same period. Therefore, it seems the market has become relatively pessimistic about the company. The reasonably low P/E ratio of 6.07 also suggests market apprehension.
The company's earnings per share (over time) is depicted in the image below (click to see the exact numbers).
It is of course excellent to see how BAWAG Group has grown profits over the years, but the future is more important for shareholders. If you are thinking of buying or selling BAWAG Group stock, you should check out this FREE detailed report on its balance sheet.
What About Dividends?
As well as measuring the share price return, investors should also consider the total shareholder return (TSR). Whereas the share price return only reflects the change in the share price, the TSR includes the value of dividends (assuming they were reinvested) and the benefit of any discounted capital raising or spin-off. So for companies that pay a generous dividend, the TSR is often a lot higher than the share price return. As it happens, BAWAG Group's TSR for the last 5 years was 63%, which exceeds the share price return mentioned earlier. The dividends paid by the company have thusly boosted the total shareholder return.
A Different Perspective
BAWAG Group shareholders are down 2.0% for the year (even including dividends), but the market itself is up 7.1%. However, keep in mind that even the best stocks will sometimes underperform the market over a twelve month period. Longer term investors wouldn't be so upset, since they would have made 10%, each year, over five years. It could be that the recent sell-off is an opportunity, so it may be worth checking the fundamental data for signs of a long term growth trend. I find it very interesting to look at share price over the long term as a proxy for business performance. But to truly gain insight, we need to consider other information, too. For instance, we've identified 1 warning sign for BAWAG Group that you should be aware of.
If you like to buy stocks alongside management, then you might just love this free list of companies. (Hint: insiders have been buying them).
Please note, the market returns quoted in this article reflect the market weighted average returns of stocks that currently trade on Austrian exchanges.
Valuation is complex, but we're helping make it simple.
Find out whether BAWAG Group is potentially over or undervalued by checking out our comprehensive analysis, which includes fair value estimates, risks and warnings, dividends, insider transactions and financial health.
View the Free AnalysisHave feedback on this article? Concerned about the content? Get in touch with us directly. Alternatively, email editorial-team (at) simplywallst.com.
This article by Simply Wall St is general in nature. We provide commentary based on historical data and analyst forecasts only using an unbiased methodology and our articles are not intended to be financial advice. It does not constitute a recommendation to buy or sell any stock, and does not take account of your objectives, or your financial situation. We aim to bring you long-term focused analysis driven by fundamental data. Note that our analysis may not factor in the latest price-sensitive company announcements or qualitative material. Simply Wall St has no position in any stocks mentioned.
About WBAG:BG
BAWAG Group
BAWAG Group AG operates as a holding company for BAWAG P.S.K.
Undervalued with solid track record and pays a dividend.
