- United Arab Emirates
- /
- Capital Markets
- /
- DFM:DFM
Dubai Financial Market P.J.S.C's (DFM:DFM) 28% CAGR outpaced the company's earnings growth over the same three-year period


The most you can lose on any stock (assuming you don't use leverage) is 100% of your money. But if you buy shares in a really great company, you can more than double your money. For instance the Dubai Financial Market P.J.S.C. (DFM:DFM) share price is 104% higher than it was three years ago. How nice for those who held the stock! In more good news, the share price has risen 11% in thirty days. This could be related to the recent financial results that were recently released - you could check the most recent data by reading our company report.
After a strong gain in the past week, it's worth seeing if longer term returns have been driven by improving fundamentals.
Check out our latest analysis for Dubai Financial Market P.J.S.C
There is no denying that markets are sometimes efficient, but prices do not always reflect underlying business performance. One imperfect but simple way to consider how the market perception of a company has shifted is to compare the change in the earnings per share (EPS) with the share price movement.
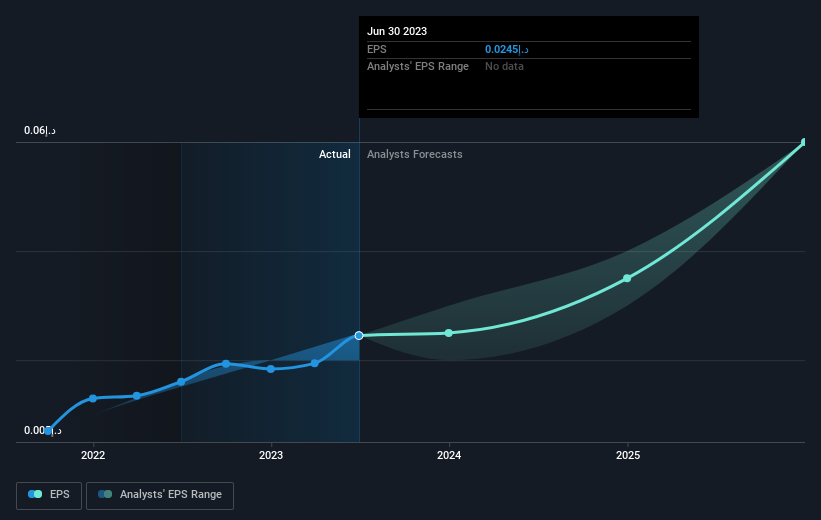
During three years of share price growth, Dubai Financial Market P.J.S.C achieved compound earnings per share growth of 13% per year. This EPS growth is lower than the 27% average annual increase in the share price. So it's fair to assume the market has a higher opinion of the business than it did three years ago. It's not unusual to see the market 're-rate' a stock, after a few years of growth. This optimism is also reflected in the fairly generous P/E ratio of 67.74.
You can see how EPS has changed over time in the image below (click on the chart to see the exact values).
We know that Dubai Financial Market P.J.S.C has improved its bottom line lately, but is it going to grow revenue? Check if analysts think Dubai Financial Market P.J.S.C will grow revenue in the future.
What About Dividends?
As well as measuring the share price return, investors should also consider the total shareholder return (TSR). The TSR is a return calculation that accounts for the value of cash dividends (assuming that any dividend received was reinvested) and the calculated value of any discounted capital raisings and spin-offs. It's fair to say that the TSR gives a more complete picture for stocks that pay a dividend. In the case of Dubai Financial Market P.J.S.C, it has a TSR of 109% for the last 3 years. That exceeds its share price return that we previously mentioned. And there's no prize for guessing that the dividend payments largely explain the divergence!
A Different Perspective
While the broader market gained around 17% in the last year, Dubai Financial Market P.J.S.C shareholders lost 3.9% (even including dividends). However, keep in mind that even the best stocks will sometimes underperform the market over a twelve month period. Longer term investors wouldn't be so upset, since they would have made 13%, each year, over five years. If the fundamental data continues to indicate long term sustainable growth, the current sell-off could be an opportunity worth considering. Before deciding if you like the current share price, check how Dubai Financial Market P.J.S.C scores on these 3 valuation metrics.
But note: Dubai Financial Market P.J.S.C may not be the best stock to buy. So take a peek at this free list of interesting companies with past earnings growth (and further growth forecast).
Please note, the market returns quoted in this article reflect the market weighted average returns of stocks that currently trade on Emirian exchanges.
New: Manage All Your Stock Portfolios in One Place
We've created the ultimate portfolio companion for stock investors, and it's free.
• Connect an unlimited number of Portfolios and see your total in one currency
• Be alerted to new Warning Signs or Risks via email or mobile
• Track the Fair Value of your stocks
Have feedback on this article? Concerned about the content? Get in touch with us directly. Alternatively, email editorial-team (at) simplywallst.com.
This article by Simply Wall St is general in nature. We provide commentary based on historical data and analyst forecasts only using an unbiased methodology and our articles are not intended to be financial advice. It does not constitute a recommendation to buy or sell any stock, and does not take account of your objectives, or your financial situation. We aim to bring you long-term focused analysis driven by fundamental data. Note that our analysis may not factor in the latest price-sensitive company announcements or qualitative material. Simply Wall St has no position in any stocks mentioned.
About DFM:DFM
Dubai Financial Market P.J.S.C
Operates the Dubai stock exchange and related clearing house in Dubai.
Solid track record with excellent balance sheet.

