Stock Analysis
- United Arab Emirates
- /
- Diversified Financial
- /
- ADX:INVICTUS
Invictus Investment's (ADX:INVICTUS one-year decrease in earnings delivers investors with a 23% loss

Passive investing in an index fund is a good way to ensure your own returns roughly match the overall market. But if you buy individual stocks, you can do both better or worse than that. Investors in Invictus Investment Company PLC (ADX:INVICTUS) have tasted that bitter downside in the last year, as the share price dropped 26%. That's disappointing when you consider the market returned 12%. Invictus Investment may have better days ahead, of course; we've only looked at a one year period. The last week also saw the share price slip down another 5.7%.
After losing 5.7% this past week, it's worth investigating the company's fundamentals to see what we can infer from past performance.
Check out our latest analysis for Invictus Investment
There is no denying that markets are sometimes efficient, but prices do not always reflect underlying business performance. By comparing earnings per share (EPS) and share price changes over time, we can get a feel for how investor attitudes to a company have morphed over time.
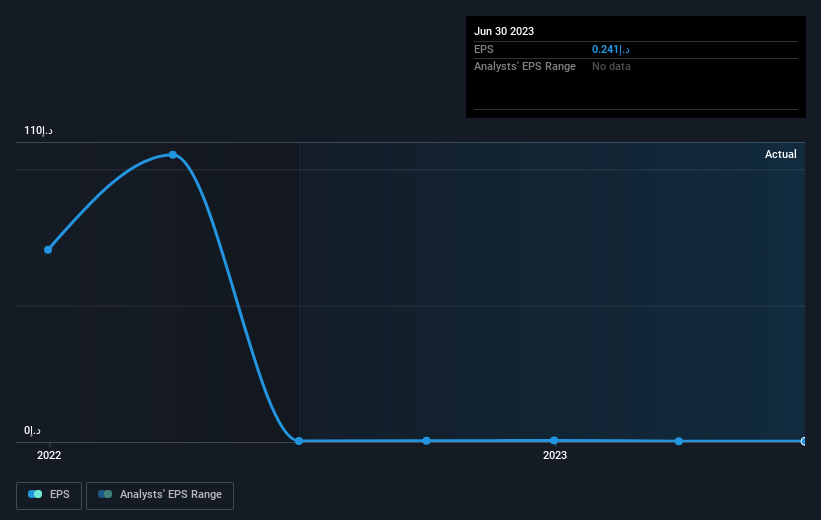
Unfortunately Invictus Investment reported an EPS drop of 40% for the last year. This fall in the EPS is significantly worse than the 26% the share price fall. So the market may not be too worried about the EPS figure, at the moment -- or it may have expected earnings to drop faster.
The image below shows how EPS has tracked over time (if you click on the image you can see greater detail).
This free interactive report on Invictus Investment's earnings, revenue and cash flow is a great place to start, if you want to investigate the stock further.
What About Dividends?
When looking at investment returns, it is important to consider the difference between total shareholder return (TSR) and share price return. The TSR incorporates the value of any spin-offs or discounted capital raisings, along with any dividends, based on the assumption that the dividends are reinvested. So for companies that pay a generous dividend, the TSR is often a lot higher than the share price return. In the case of Invictus Investment, it has a TSR of -23% for the last 1 year. That exceeds its share price return that we previously mentioned. This is largely a result of its dividend payments!
A Different Perspective
Given that the market gained 12% in the last year, Invictus Investment shareholders might be miffed that they lost 23% (even including dividends). However, keep in mind that even the best stocks will sometimes underperform the market over a twelve month period. The share price decline has continued throughout the most recent three months, down 3.1%, suggesting an absence of enthusiasm from investors. Given the relatively short history of this stock, we'd remain pretty wary until we see some strong business performance. I find it very interesting to look at share price over the long term as a proxy for business performance. But to truly gain insight, we need to consider other information, too. Case in point: We've spotted 4 warning signs for Invictus Investment you should be aware of, and 2 of them don't sit too well with us.
We will like Invictus Investment better if we see some big insider buys. While we wait, check out this free list of growing companies with considerable, recent, insider buying.
Please note, the market returns quoted in this article reflect the market weighted average returns of stocks that currently trade on Emirian exchanges.
Valuation is complex, but we're helping make it simple.
Find out whether Invictus Investment is potentially over or undervalued by checking out our comprehensive analysis, which includes fair value estimates, risks and warnings, dividends, insider transactions and financial health.
View the Free AnalysisHave feedback on this article? Concerned about the content? Get in touch with us directly. Alternatively, email editorial-team (at) simplywallst.com.
This article by Simply Wall St is general in nature. We provide commentary based on historical data and analyst forecasts only using an unbiased methodology and our articles are not intended to be financial advice. It does not constitute a recommendation to buy or sell any stock, and does not take account of your objectives, or your financial situation. We aim to bring you long-term focused analysis driven by fundamental data. Note that our analysis may not factor in the latest price-sensitive company announcements or qualitative material. Simply Wall St has no position in any stocks mentioned.
About ADX:INVICTUS
Invictus Investment
Invictus Investment Company PLC, together with its subsidiaries, engages in trading of agricultural commodities and food products in Africa, the Middle East, Europe, North America, and Asia.
Fair value with mediocre balance sheet.

