Stock Analysis
CTS' (NYSE:CTS) earnings growth rate lags the 14% CAGR delivered to shareholders

By buying an index fund, investors can approximate the average market return. But if you buy good businesses at attractive prices, your portfolio returns could exceed the average market return. For example, CTS Corporation (NYSE:CTS) shareholders have seen the share price rise 45% over three years, well in excess of the market return (11%, not including dividends).
While the stock has fallen 4.6% this week, it's worth focusing on the longer term and seeing if the stocks historical returns have been driven by the underlying fundamentals.
Check out our latest analysis for CTS
While the efficient markets hypothesis continues to be taught by some, it has been proven that markets are over-reactive dynamic systems, and investors are not always rational. One flawed but reasonable way to assess how sentiment around a company has changed is to compare the earnings per share (EPS) with the share price.
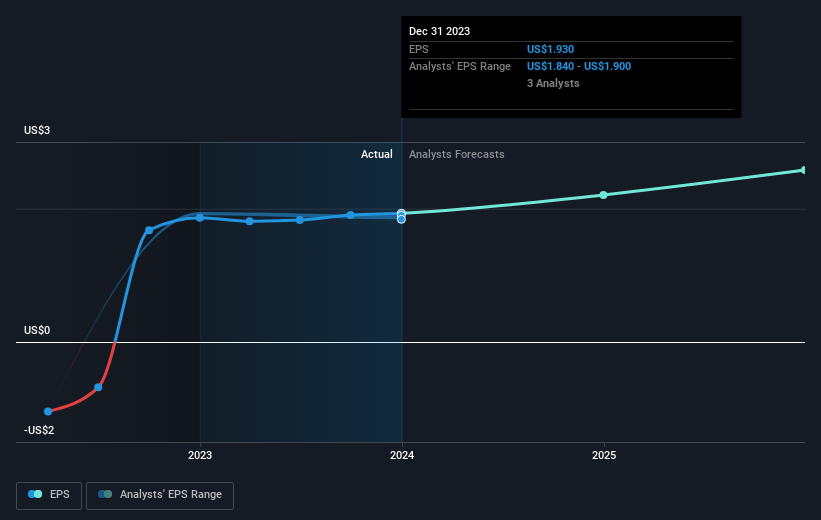
CTS was able to grow its EPS at 22% per year over three years, sending the share price higher. This EPS growth is higher than the 13% average annual increase in the share price. Therefore, it seems the market has moderated its expectations for growth, somewhat.
The graphic below depicts how EPS has changed over time (unveil the exact values by clicking on the image).
We're pleased to report that the CEO is remunerated more modestly than most CEOs at similarly capitalized companies. It's always worth keeping an eye on CEO pay, but a more important question is whether the company will grow earnings throughout the years. Dive deeper into the earnings by checking this interactive graph of CTS' earnings, revenue and cash flow.
A Different Perspective
CTS shareholders are down 1.7% for the year (even including dividends), but the market itself is up 22%. However, keep in mind that even the best stocks will sometimes underperform the market over a twelve month period. On the bright side, long term shareholders have made money, with a gain of 8% per year over half a decade. It could be that the recent sell-off is an opportunity, so it may be worth checking the fundamental data for signs of a long term growth trend. Before deciding if you like the current share price, check how CTS scores on these 3 valuation metrics.
If you like to buy stocks alongside management, then you might just love this free list of companies. (Hint: insiders have been buying them).
Please note, the market returns quoted in this article reflect the market weighted average returns of stocks that currently trade on American exchanges.
Valuation is complex, but we're helping make it simple.
Find out whether CTS is potentially over or undervalued by checking out our comprehensive analysis, which includes fair value estimates, risks and warnings, dividends, insider transactions and financial health.
View the Free AnalysisHave feedback on this article? Concerned about the content? Get in touch with us directly. Alternatively, email editorial-team (at) simplywallst.com.
This article by Simply Wall St is general in nature. We provide commentary based on historical data and analyst forecasts only using an unbiased methodology and our articles are not intended to be financial advice. It does not constitute a recommendation to buy or sell any stock, and does not take account of your objectives, or your financial situation. We aim to bring you long-term focused analysis driven by fundamental data. Note that our analysis may not factor in the latest price-sensitive company announcements or qualitative material. Simply Wall St has no position in any stocks mentioned.

Simply Wall St
About NYSE:CTS
CTS
CTS Corporation manufactures and sells sensors, actuators, and connectivity components in North America, Europe, and Asia.
Flawless balance sheet with solid track record.
