Stock Analysis
- Sweden
- /
- Real Estate
- /
- OM:WALL B
Shareholders in Wallenstam (STO:WALL B) have lost 32%, as stock drops 3.7% this past week


Many investors define successful investing as beating the market average over the long term. But if you try your hand at stock picking, your risk returning less than the market. Unfortunately, that's been the case for longer term Wallenstam AB (publ) (STO:WALL B) shareholders, since the share price is down 34% in the last three years, falling well short of the market decline of around 6.6%.
Since Wallenstam has shed kr1.2b from its value in the past 7 days, let's see if the longer term decline has been driven by the business' economics.
Check out our latest analysis for Wallenstam
While markets are a powerful pricing mechanism, share prices reflect investor sentiment, not just underlying business performance. One imperfect but simple way to consider how the market perception of a company has shifted is to compare the change in the earnings per share (EPS) with the share price movement.
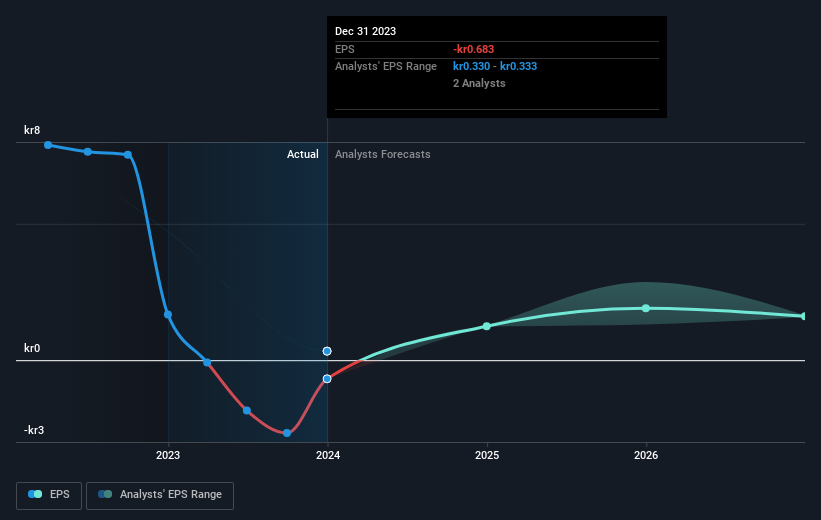
Over the three years that the share price declined, Wallenstam's earnings per share (EPS) dropped significantly, falling to a loss. Extraordinary items contributed to this situation. Due to the loss, it's not easy to use EPS as a reliable guide to the business. However, we can say we'd expect to see a falling share price in this scenario.
You can see below how EPS has changed over time (discover the exact values by clicking on the image).
We like that insiders have been buying shares in the last twelve months. Even so, future earnings will be far more important to whether current shareholders make money. It might be well worthwhile taking a look at our free report on Wallenstam's earnings, revenue and cash flow.
What About Dividends?
As well as measuring the share price return, investors should also consider the total shareholder return (TSR). The TSR incorporates the value of any spin-offs or discounted capital raisings, along with any dividends, based on the assumption that the dividends are reinvested. It's fair to say that the TSR gives a more complete picture for stocks that pay a dividend. In the case of Wallenstam, it has a TSR of -32% for the last 3 years. That exceeds its share price return that we previously mentioned. And there's no prize for guessing that the dividend payments largely explain the divergence!
A Different Perspective
It's nice to see that Wallenstam shareholders have received a total shareholder return of 14% over the last year. Of course, that includes the dividend. Since the one-year TSR is better than the five-year TSR (the latter coming in at 0.2% per year), it would seem that the stock's performance has improved in recent times. Given the share price momentum remains strong, it might be worth taking a closer look at the stock, lest you miss an opportunity. It's always interesting to track share price performance over the longer term. But to understand Wallenstam better, we need to consider many other factors. For instance, we've identified 2 warning signs for Wallenstam (1 is significant) that you should be aware of.
If you like to buy stocks alongside management, then you might just love this free list of companies. (Hint: insiders have been buying them).
Please note, the market returns quoted in this article reflect the market weighted average returns of stocks that currently trade on Swedish exchanges.
Valuation is complex, but we're helping make it simple.
Find out whether Wallenstam is potentially over or undervalued by checking out our comprehensive analysis, which includes fair value estimates, risks and warnings, dividends, insider transactions and financial health.
View the Free AnalysisHave feedback on this article? Concerned about the content? Get in touch with us directly. Alternatively, email editorial-team (at) simplywallst.com.
This article by Simply Wall St is general in nature. We provide commentary based on historical data and analyst forecasts only using an unbiased methodology and our articles are not intended to be financial advice. It does not constitute a recommendation to buy or sell any stock, and does not take account of your objectives, or your financial situation. We aim to bring you long-term focused analysis driven by fundamental data. Note that our analysis may not factor in the latest price-sensitive company announcements or qualitative material. Simply Wall St has no position in any stocks mentioned.
About OM:WALL B
Wallenstam
Wallenstam AB (publ) operates as a property company in Sweden.
Reasonable growth potential unattractive dividend payer.
