Stock Analysis
- Netherlands
- /
- Oil and Gas
- /
- ENXTAM:VPK
Despite delivering investors losses of 1.5% over the past 5 years, Koninklijke Vopak (AMS:VPK) has been growing its earnings
While it may not be enough for some shareholders, we think it is good to see the Koninklijke Vopak N.V. (AMS:VPK) share price up 17% in a single quarter. But if you look at the last five years the returns have not been good. After all, the share price is down 16% in that time, significantly under-performing the market.
On a more encouraging note the company has added €199m to its market cap in just the last 7 days, so let's see if we can determine what's driven the five-year loss for shareholders.
See our latest analysis for Koninklijke Vopak
To quote Buffett, 'Ships will sail around the world but the Flat Earth Society will flourish. There will continue to be wide discrepancies between price and value in the marketplace...' One flawed but reasonable way to assess how sentiment around a company has changed is to compare the earnings per share (EPS) with the share price.
Koninklijke Vopak became profitable within the last five years. Most would consider that to be a good thing, so it's counter-intuitive to see the share price declining. Other metrics might give us a better handle on how its value is changing over time.
The steady dividend doesn't really explain why the share price is down. It's not immediately clear to us why the stock price is down but further research might provide some answers.
You can see below how earnings and revenue have changed over time (discover the exact values by clicking on the image).
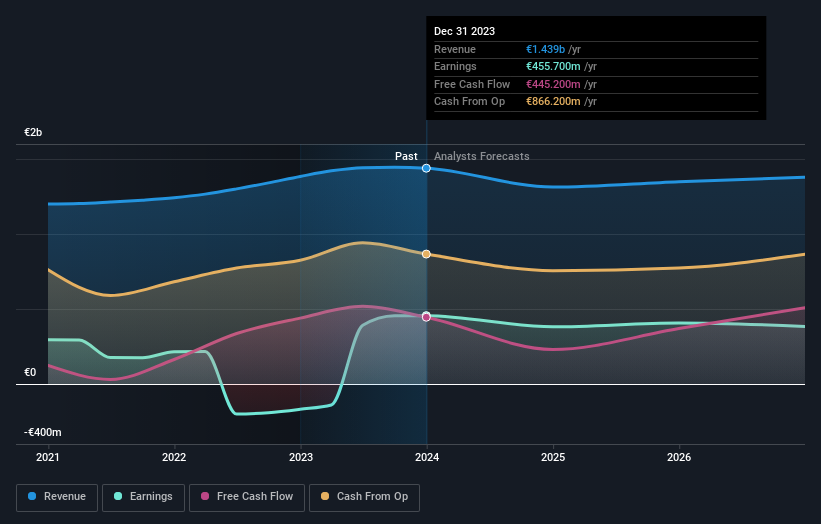
We know that Koninklijke Vopak has improved its bottom line lately, but what does the future have in store? If you are thinking of buying or selling Koninklijke Vopak stock, you should check out this free report showing analyst profit forecasts.
What About Dividends?
When looking at investment returns, it is important to consider the difference between total shareholder return (TSR) and share price return. Whereas the share price return only reflects the change in the share price, the TSR includes the value of dividends (assuming they were reinvested) and the benefit of any discounted capital raising or spin-off. It's fair to say that the TSR gives a more complete picture for stocks that pay a dividend. We note that for Koninklijke Vopak the TSR over the last 5 years was -1.5%, which is better than the share price return mentioned above. The dividends paid by the company have thusly boosted the total shareholder return.
A Different Perspective
Koninklijke Vopak shareholders gained a total return of 15% during the year. But that was short of the market average. But at least that's still a gain! Over five years the TSR has been a reduction of 0.3% per year, over five years. So this might be a sign the business has turned its fortunes around. I find it very interesting to look at share price over the long term as a proxy for business performance. But to truly gain insight, we need to consider other information, too. To that end, you should learn about the 2 warning signs we've spotted with Koninklijke Vopak (including 1 which can't be ignored) .
Of course Koninklijke Vopak may not be the best stock to buy. So you may wish to see this free collection of growth stocks.
Please note, the market returns quoted in this article reflect the market weighted average returns of stocks that currently trade on Dutch exchanges.
Valuation is complex, but we're helping make it simple.
Find out whether Koninklijke Vopak is potentially over or undervalued by checking out our comprehensive analysis, which includes fair value estimates, risks and warnings, dividends, insider transactions and financial health.
View the Free AnalysisHave feedback on this article? Concerned about the content? Get in touch with us directly. Alternatively, email editorial-team (at) simplywallst.com.
This article by Simply Wall St is general in nature. We provide commentary based on historical data and analyst forecasts only using an unbiased methodology and our articles are not intended to be financial advice. It does not constitute a recommendation to buy or sell any stock, and does not take account of your objectives, or your financial situation. We aim to bring you long-term focused analysis driven by fundamental data. Note that our analysis may not factor in the latest price-sensitive company announcements or qualitative material. Simply Wall St has no position in any stocks mentioned.
About ENXTAM:VPK
Koninklijke Vopak
Koninklijke Vopak N.V., an independent tank storage company, stores and handles liquid chemicals, gases, and oil products to the energy and manufacturing markets worldwide.
Established dividend payer and fair value.

