Stock Analysis
- United Kingdom
- /
- Real Estate
- /
- AIM:WJG
Watkin Jones (LON:WJG) shareholders are up 10% this past week, but still in the red over the last three years


This week we saw the Watkin Jones Plc (LON:WJG) share price climb by 10%. But only the myopic could ignore the astounding decline over three years. To wit, the share price sky-dived 82% in that time. Arguably, the recent bounce is to be expected after such a bad drop. The thing to think about is whether the business has really turned around. We really feel for shareholders in this scenario. It's a good reminder of the importance of diversification, and it's worth keeping in mind there's more to life than money, anyway.
While the last three years has been tough for Watkin Jones shareholders, this past week has shown signs of promise. So let's look at the longer term fundamentals and see if they've been the driver of the negative returns.
See our latest analysis for Watkin Jones
While the efficient markets hypothesis continues to be taught by some, it has been proven that markets are over-reactive dynamic systems, and investors are not always rational. One imperfect but simple way to consider how the market perception of a company has shifted is to compare the change in the earnings per share (EPS) with the share price movement.
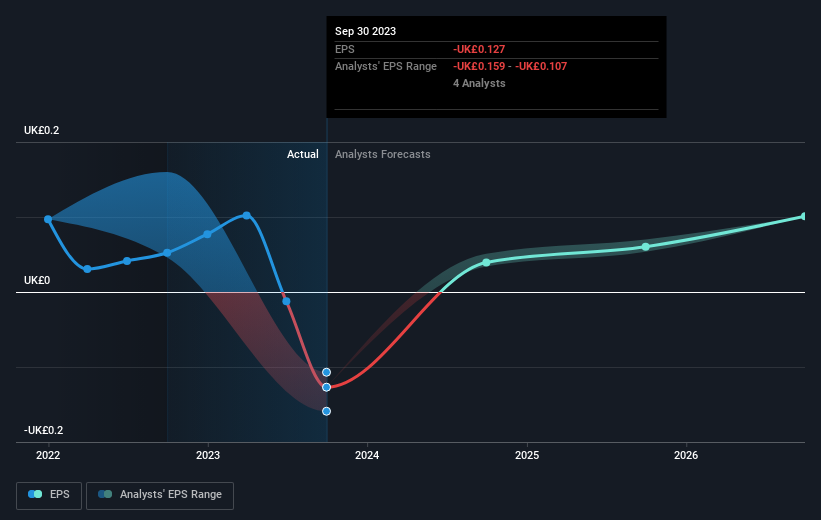
Over the three years that the share price declined, Watkin Jones' earnings per share (EPS) dropped significantly, falling to a loss. Due to the loss, it's not easy to use EPS as a reliable guide to the business. But it's safe to say we'd generally expect the share price to be lower as a result!
The company's earnings per share (over time) is depicted in the image below (click to see the exact numbers).
We like that insiders have been buying shares in the last twelve months. Even so, future earnings will be far more important to whether current shareholders make money. Dive deeper into the earnings by checking this interactive graph of Watkin Jones' earnings, revenue and cash flow.
What About The Total Shareholder Return (TSR)?
We've already covered Watkin Jones' share price action, but we should also mention its total shareholder return (TSR). The TSR is a return calculation that accounts for the value of cash dividends (assuming that any dividend received was reinvested) and the calculated value of any discounted capital raisings and spin-offs. Watkin Jones' TSR of was a loss of 80% for the 3 years. That wasn't as bad as its share price return, because it has paid dividends.
A Different Perspective
While the broader market gained around 4.6% in the last year, Watkin Jones shareholders lost 51%. However, keep in mind that even the best stocks will sometimes underperform the market over a twelve month period. Unfortunately, last year's performance may indicate unresolved challenges, given that it was worse than the annualised loss of 12% over the last half decade. We realise that Baron Rothschild has said investors should "buy when there is blood on the streets", but we caution that investors should first be sure they are buying a high quality business. It is all well and good that insiders have been buying shares, but we suggest you check here to see what price insiders were buying at.
There are plenty of other companies that have insiders buying up shares. You probably do not want to miss this free list of growing companies that insiders are buying.
Please note, the market returns quoted in this article reflect the market weighted average returns of stocks that currently trade on British exchanges.
Valuation is complex, but we're helping make it simple.
Find out whether Watkin Jones is potentially over or undervalued by checking out our comprehensive analysis, which includes fair value estimates, risks and warnings, dividends, insider transactions and financial health.
View the Free AnalysisHave feedback on this article? Concerned about the content? Get in touch with us directly. Alternatively, email editorial-team (at) simplywallst.com.
This article by Simply Wall St is general in nature. We provide commentary based on historical data and analyst forecasts only using an unbiased methodology and our articles are not intended to be financial advice. It does not constitute a recommendation to buy or sell any stock, and does not take account of your objectives, or your financial situation. We aim to bring you long-term focused analysis driven by fundamental data. Note that our analysis may not factor in the latest price-sensitive company announcements or qualitative material. Simply Wall St has no position in any stocks mentioned.
About AIM:WJG
Watkin Jones
Watkin Jones Plc engages in the development and the management of properties for residential occupation in the United Kingdom.
Undervalued with reasonable growth potential.
