Stock Analysis
- Belgium
- /
- Personal Products
- /
- ENXTBR:ONTEX
Capital Allocation Trends At Ontex Group (EBR:ONTEX) Aren't Ideal

When it comes to investing, there are some useful financial metrics that can warn us when a business is potentially in trouble. Businesses in decline often have two underlying trends, firstly, a declining return on capital employed (ROCE) and a declining base of capital employed. Basically the company is earning less on its investments and it is also reducing its total assets. On that note, looking into Ontex Group (EBR:ONTEX), we weren't too upbeat about how things were going.
Return On Capital Employed (ROCE): What Is It?
For those that aren't sure what ROCE is, it measures the amount of pre-tax profits a company can generate from the capital employed in its business. The formula for this calculation on Ontex Group is:
Return on Capital Employed = Earnings Before Interest and Tax (EBIT) ÷ (Total Assets - Current Liabilities)
0.064 = €103m ÷ (€2.4b - €752m) (Based on the trailing twelve months to December 2023).
Therefore, Ontex Group has an ROCE of 6.4%. In absolute terms, that's a low return and it also under-performs the Personal Products industry average of 11%.
See our latest analysis for Ontex Group
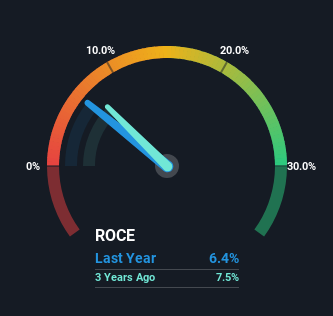
Above you can see how the current ROCE for Ontex Group compares to its prior returns on capital, but there's only so much you can tell from the past. If you're interested, you can view the analysts predictions in our free analyst report for Ontex Group .
How Are Returns Trending?
We are a bit anxious about the trends of ROCE at Ontex Group. To be more specific, today's ROCE was 8.5% five years ago but has since fallen to 6.4%. In addition to that, Ontex Group is now employing 21% less capital than it was five years ago. The fact that both are shrinking is an indication that the business is going through some tough times. Typically businesses that exhibit these characteristics aren't the ones that tend to multiply over the long term, because statistically speaking, they've already gone through the growth phase of their life cycle.
Our Take On Ontex Group's ROCE
In short, lower returns and decreasing amounts capital employed in the business doesn't fill us with confidence. Investors haven't taken kindly to these developments, since the stock has declined 60% from where it was five years ago. With underlying trends that aren't great in these areas, we'd consider looking elsewhere.
One more thing: We've identified 2 warning signs with Ontex Group (at least 1 which is potentially serious) , and understanding them would certainly be useful.
While Ontex Group may not currently earn the highest returns, we've compiled a list of companies that currently earn more than 25% return on equity. Check out this free list here.
Valuation is complex, but we're helping make it simple.
Find out whether Ontex Group is potentially over or undervalued by checking out our comprehensive analysis, which includes fair value estimates, risks and warnings, dividends, insider transactions and financial health.
View the Free AnalysisHave feedback on this article? Concerned about the content? Get in touch with us directly. Alternatively, email editorial-team (at) simplywallst.com.
This article by Simply Wall St is general in nature. We provide commentary based on historical data and analyst forecasts only using an unbiased methodology and our articles are not intended to be financial advice. It does not constitute a recommendation to buy or sell any stock, and does not take account of your objectives, or your financial situation. We aim to bring you long-term focused analysis driven by fundamental data. Note that our analysis may not factor in the latest price-sensitive company announcements or qualitative material. Simply Wall St has no position in any stocks mentioned.
About ENXTBR:ONTEX
Ontex Group
Ontex Group NV develops, produces, and supplies personal hygiene products and solutions for baby, feminine, and adult care in Belgium, the United Kingdom, the United States, Italy, France, and internationally.
Moderate growth potential with mediocre balance sheet.

