- India
- /
- Construction
- /
- NSEI:ASHOKA
Is There More Growth In Store For Ashoka Buildcon's (NSE:ASHOKA) Returns On Capital?


If you're looking for a multi-bagger, there's a few things to keep an eye out for. Typically, we'll want to notice a trend of growing return on capital employed (ROCE) and alongside that, an expanding base of capital employed. Put simply, these types of businesses are compounding machines, meaning they are continually reinvesting their earnings at ever-higher rates of return. Speaking of which, we noticed some great changes in Ashoka Buildcon's (NSE:ASHOKA) returns on capital, so let's have a look.
Understanding Return On Capital Employed (ROCE)
If you haven't worked with ROCE before, it measures the 'return' (pre-tax profit) a company generates from capital employed in its business. To calculate this metric for Ashoka Buildcon, this is the formula:
Return on Capital Employed = Earnings Before Interest and Tax (EBIT) ÷ (Total Assets - Current Liabilities)
0.14 = ₹13b ÷ (₹136b - ₹44b) (Based on the trailing twelve months to March 2020).
Thus, Ashoka Buildcon has an ROCE of 14%. That's a relatively normal return on capital, and it's around the 13% generated by the Construction industry.
View our latest analysis for Ashoka Buildcon
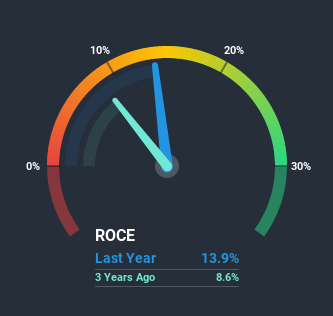
In the above chart we have a measured Ashoka Buildcon's prior ROCE against its prior performance, but the future is arguably more important. If you're interested, you can view the analysts predictions in our free report on analyst forecasts for the company.
What The Trend Of ROCE Can Tell Us
You'd find it hard not to be impressed with the ROCE trend at Ashoka Buildcon. The figures show that over the last five years, returns on capital have grown by 414%. That's a very favorable trend because this means that the company is earning more per dollar of capital that's being employed. Interestingly, the business may be becoming more efficient because it's applying 31% less capital than it was five years ago. If this trend continues, the business might be getting more efficient but it's shrinking in terms of total assets.
On a side note, we noticed that the improvement in ROCE appears to be partly fueled by an increase in current liabilities. Effectively this means that suppliers or short-term creditors are now funding 33% of the business, which is more than it was five years ago. Keep an eye out for future increases because when the ratio of current liabilities to total assets gets particularly high, this can introduce some new risks for the business.What We Can Learn From Ashoka Buildcon's ROCE
From what we've seen above, Ashoka Buildcon has managed to increase it's returns on capital all the while reducing it's capital base. And since the stock has fallen 57% over the last five years, there might be an opportunity here. With that in mind, we believe the promising trends warrant this stock for further investigation.
On a final note, we found 3 warning signs for Ashoka Buildcon (2 are a bit unpleasant) you should be aware of.
While Ashoka Buildcon may not currently earn the highest returns, we've compiled a list of companies that currently earn more than 25% return on equity. Check out this free list here.
If you decide to trade Ashoka Buildcon, use the lowest-cost* platform that is rated #1 Overall by Barron’s, Interactive Brokers. Trade stocks, options, futures, forex, bonds and funds on 135 markets, all from a single integrated account. Promoted
New: Manage All Your Stock Portfolios in One Place
We've created the ultimate portfolio companion for stock investors, and it's free.
• Connect an unlimited number of Portfolios and see your total in one currency
• Be alerted to new Warning Signs or Risks via email or mobile
• Track the Fair Value of your stocks
This article by Simply Wall St is general in nature. It does not constitute a recommendation to buy or sell any stock, and does not take account of your objectives, or your financial situation. We aim to bring you long-term focused analysis driven by fundamental data. Note that our analysis may not factor in the latest price-sensitive company announcements or qualitative material. Simply Wall St has no position in any stocks mentioned.
*Interactive Brokers Rated Lowest Cost Broker by StockBrokers.com Annual Online Review 2020
Have feedback on this article? Concerned about the content? Get in touch with us directly. Alternatively, email editorial-team@simplywallst.com.
About NSEI:ASHOKA
Ashoka Buildcon
Engages in the infrastructure development business in India.
Solid track record and fair value.

