- India
- /
- Basic Materials
- /
- NSEI:PRSMJOHNSN
Is Prism Johnson Limited (NSE:PRSMJOHNSN) An Attractive Dividend Stock?


Is Prism Johnson Limited (NSE:PRSMJOHNSN) a good dividend stock? How can we tell? Dividend paying companies with growing earnings can be highly rewarding in the long term. If you are hoping to live on the income from dividends, it's important to be a lot more stringent with your investments than the average punter.
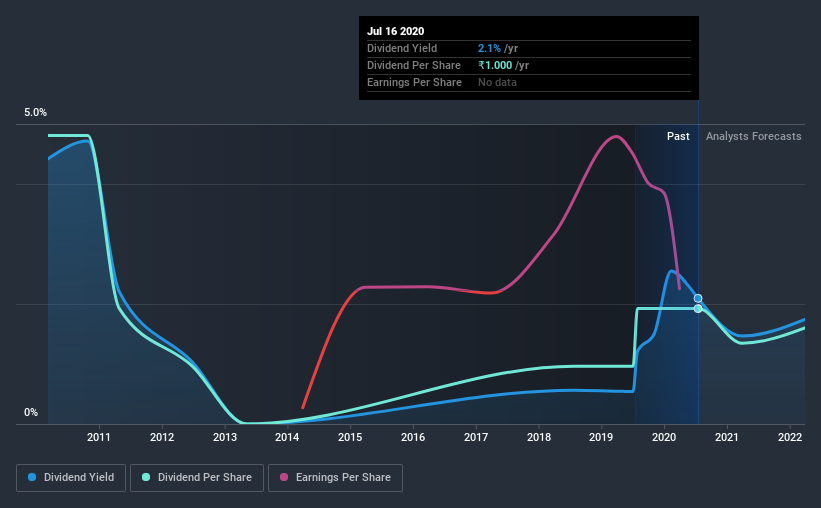
While Prism Johnson's 2.1% dividend yield is not the highest, we think its lengthy payment history is quite interesting. There are a few simple ways to reduce the risks of buying Prism Johnson for its dividend, and we'll go through these below.
Explore this interactive chart for our latest analysis on Prism Johnson!
Payout ratios
Dividends are usually paid out of company earnings. If a company is paying more than it earns, then the dividend might become unsustainable - hardly an ideal situation. As a result, we should always investigate whether a company can afford its dividend, measured as a percentage of a company's net income after tax. Prism Johnson paid out 3333% of its profit as dividends, over the trailing twelve month period. Unless there are extenuating circumstances, from the perspective of an investor who hopes to own the company for many years, a payout ratio of above 100% is definitely a concern.
Another important check we do is to see if the free cash flow generated is sufficient to pay the dividend. Prism Johnson paid out 101% of its free cash flow last year, suggesting the dividend is poorly covered by cash flow. Cash is slightly more important than profit from a dividend perspective, but given Prism Johnson's payments were not well covered by either earnings or cash flow, we are concerned about the sustainability of this dividend.
Is Prism Johnson's Balance Sheet Risky?
As Prism Johnson's dividend was not well covered by earnings, we need to check its balance sheet for signs of financial distress. A rough way to check this is with these two simple ratios: a) net debt divided by EBITDA (earnings before interest, tax, depreciation and amortisation), and b) net interest cover. Net debt to EBITDA measures total debt load relative to company earnings (lower = less debt), while net interest cover measures the ability to pay interest on the debt (higher = greater ability to pay interest costs). With net debt of 2.06 times its EBITDA, Prism Johnson's debt burden is within a normal range for most listed companies.
Net interest cover can be calculated by dividing earnings before interest and tax (EBIT) by the company's net interest expense. With EBIT of 1.24 times its interest expense, Prism Johnson's interest cover is starting to look a bit thin.
Remember, you can always get a snapshot of Prism Johnson's latest financial position, by checking our visualisation of its financial health.
Dividend Volatility
From the perspective of an income investor who wants to earn dividends for many years, there is not much point buying a stock if its dividend is regularly cut or is not reliable. Prism Johnson has been paying dividends for a long time, but for the purpose of this analysis, we only examine the past 10 years of payments. The dividend has been cut on at least one occasion historically. During the past ten-year period, the first annual payment was ₹2.5 in 2010, compared to ₹1.0 last year. This works out to be a decline of approximately 8.8% per year over that time. Prism Johnson's dividend has been cut sharply at least once, so it hasn't fallen by 8.8% every year, but this is a decent approximation of the long term change.
We struggle to make a case for buying Prism Johnson for its dividend, given that payments have shrunk over the past ten years.
Dividend Growth Potential
Given that dividend payments have been shrinking like a glacier in a warming world, we need to check if there are some bright spots on the horizon. Prism Johnson's earnings per share have shrunk at 11% a year over the past five years. With this kind of significant decline, we always wonder what has changed in the business. Dividends are about stability, and Prism Johnson's earnings per share, which support the dividend, have been anything but stable.
Conclusion
Dividend investors should always want to know if a) a company's dividends are affordable, b) if there is a track record of consistent payments, and c) if the dividend is capable of growing. Prism Johnson paid out almost all of its cash flow and profit as dividends, leaving little to reinvest in the business. Second, earnings per share have been in decline, and its dividend has been cut at least once in the past. There are a few too many issues for us to get comfortable with Prism Johnson from a dividend perspective. Businesses can change, but we would struggle to identify why an investor should rely on this stock for their income.
It's important to note that companies having a consistent dividend policy will generate greater investor confidence than those having an erratic one. Still, investors need to consider a host of other factors, apart from dividend payments, when analysing a company. To that end, Prism Johnson has 5 warning signs (and 1 which shouldn't be ignored) we think you should know about.
If you are a dividend investor, you might also want to look at our curated list of dividend stocks yielding above 3%.
When trading Prism Johnson or any other investment, use the platform considered by many to be the Professional's Gateway to the Worlds Market, Interactive Brokers. You get the lowest-cost* trading on stocks, options, futures, forex, bonds and funds worldwide from a single integrated account. Promoted
New: Manage All Your Stock Portfolios in One Place
We've created the ultimate portfolio companion for stock investors, and it's free.
• Connect an unlimited number of Portfolios and see your total in one currency
• Be alerted to new Warning Signs or Risks via email or mobile
• Track the Fair Value of your stocks
This article by Simply Wall St is general in nature. It does not constitute a recommendation to buy or sell any stock, and does not take account of your objectives, or your financial situation. We aim to bring you long-term focused analysis driven by fundamental data. Note that our analysis may not factor in the latest price-sensitive company announcements or qualitative material. Simply Wall St has no position in any stocks mentioned.
*Interactive Brokers Rated Lowest Cost Broker by StockBrokers.com Annual Online Review 2020
Have feedback on this article? Concerned about the content? Get in touch with us directly. Alternatively, email editorial-team@simplywallst.com.
About NSEI:PRSMJOHNSN
Prism Johnson
An integrated building materials company, provides cement, ready-mixed concrete, tiles, sanitaryware, and bath fittings in India and internationally.
Moderate growth potential with mediocre balance sheet.

