- India
- /
- Capital Markets
- /
- NSEI:JMFINANCIL
Investors Continue Waiting On Sidelines For JM Financial Limited (NSE:JMFINANCIL)

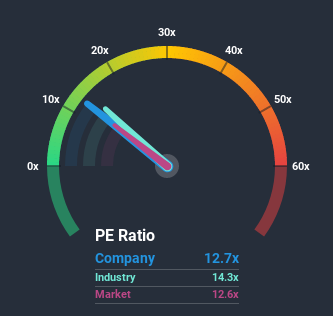
It's not a stretch to say that JM Financial Limited's (NSE:JMFINANCIL) price-to-earnings (or "P/E") ratio of 12.7x right now seems quite "middle-of-the-road" compared to the market in India, where the median P/E ratio is around 13x. However, investors might be overlooking a clear opportunity or potential setback if there is no rational basis for the P/E.
JM Financial could be doing better as its earnings have been going backwards lately while most other companies have been seeing positive earnings growth. It might be that many expect the dour earnings performance to strengthen positively, which has kept the P/E from falling. You'd really hope so, otherwise you're paying a relatively elevated price for a company with this sort of growth profile.
Check out our latest analysis for JM Financial
Where Does JM Financial's P/E Sit Within Its Industry?
An inspection of the typical P/E's throughout JM Financial's industry may help to explain its fairly average P/E ratio. You'll notice in the figure below that P/E ratios in the Capital Markets industry are also similar to the market. So this certainly goes a fair way towards explaining the company's ratio right now. Some industry P/E's don't move around a lot and right now most companies within the Capital Markets industry should be getting restrained. Nevertheless, the company's P/E should be primarily influenced by its own financial performance.

How Is JM Financial's Growth Trending?
In order to justify its P/E ratio, JM Financial would need to produce growth that's similar to the market.
If we review the last year of earnings, dishearteningly the company's profits fell to the tune of 4.9%. This has soured the latest three-year period, which nevertheless managed to deliver a decent 9.3% overall rise in EPS. Accordingly, while they would have preferred to keep the run going, shareholders would be roughly satisfied with the medium-term rates of earnings growth.
Shifting to the future, estimates from the twin analysts covering the company suggest earnings growth will be highly resilient over the next year growing by 85%. With the rest of the market predicted to shrink by 6.8%, that would be a fantastic result.
With this information, we find it odd that JM Financial is trading at a fairly similar P/E to the market. Apparently some shareholders are skeptical of the contrarian forecasts and have been accepting lower selling prices.
The Key Takeaway
Using the price-to-earnings ratio alone to determine if you should sell your stock isn't sensible, however it can be a practical guide to the company's future prospects.
We've established that JM Financial currently trades on a lower than expected P/E since its growth forecasts are potentially beating a struggling market. When we see a superior earnings outlook with some actual growth, we assume potential risks are what might be placing pressure on the P/E ratio. One major risk is whether its earnings trajectory can keep outperforming under these tough market conditions. It appears some are indeed anticipating earnings instability, because the company's current prospects should normally provide a boost to the share price.
We don't want to rain on the parade too much, but we did also find 4 warning signs for JM Financial that you need to be mindful of.
If you're unsure about the strength of JM Financial's business, why not explore our interactive list of stocks with solid business fundamentals for some other companies you may have missed.
When trading JM Financial or any other investment, use the platform considered by many to be the Professional's Gateway to the Worlds Market, Interactive Brokers. You get the lowest-cost* trading on stocks, options, futures, forex, bonds and funds worldwide from a single integrated account. Promoted
New: Manage All Your Stock Portfolios in One Place
We've created the ultimate portfolio companion for stock investors, and it's free.
• Connect an unlimited number of Portfolios and see your total in one currency
• Be alerted to new Warning Signs or Risks via email or mobile
• Track the Fair Value of your stocks
This article by Simply Wall St is general in nature. It does not constitute a recommendation to buy or sell any stock, and does not take account of your objectives, or your financial situation. We aim to bring you long-term focused analysis driven by fundamental data. Note that our analysis may not factor in the latest price-sensitive company announcements or qualitative material. Simply Wall St has no position in any stocks mentioned.
*Interactive Brokers Rated Lowest Cost Broker by StockBrokers.com Annual Online Review 2020
Have feedback on this article? Concerned about the content? Get in touch with us directly. Alternatively, email editorial-team@simplywallst.com.
About NSEI:JMFINANCIL
JM Financial
Provides various integrated and diversified financial services to corporations, financial institutions, government organizations, high net-worth individuals, and retail customers in India and internationally.
Established dividend payer moderate.

