
Advertisement
- Poland
- /
- Telecom Services and Carriers
- /
- WSE:CBF
How Does R22's (WSE:R22) P/E Compare To Its Industry, After Its Big Share Price Gain?
R22 (WSE:R22) shareholders are no doubt pleased to see that the share price has had a great month, posting a 36% gain, recovering from prior weakness. That brought the twelve month gain to a very sharp 73%.
All else being equal, a sharp share price increase should make a stock less attractive to potential investors. While the market sentiment towards a stock is very changeable, in the long run, the share price will tend to move in the same direction as earnings per share. So some would prefer to hold off buying when there is a lot of optimism towards a stock. Perhaps the simplest way to get a read on investors' expectations of a business is to look at its Price to Earnings Ratio (PE Ratio). Investors have optimistic expectations of companies with higher P/E ratios, compared to companies with lower P/E ratios.
See our latest analysis for R22
How Does R22's P/E Ratio Compare To Its Peers?
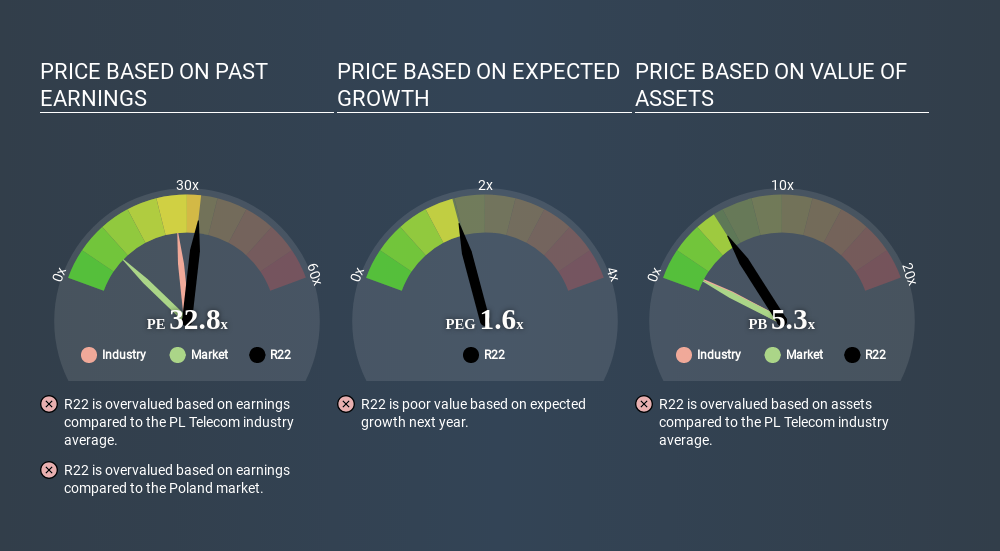
We can tell from its P/E ratio of 32.78 that there is some investor optimism about R22. The image below shows that R22 has a higher P/E than the average (27.2) P/E for companies in the telecom industry.
Its relatively high P/E ratio indicates that R22 shareholders think it will perform better than other companies in its industry classification. Clearly the market expects growth, but it isn't guaranteed. So investors should delve deeper. I like to check if company insiders have been buying or selling.
How Growth Rates Impact P/E Ratios
Generally speaking the rate of earnings growth has a profound impact on a company's P/E multiple. Earnings growth means that in the future the 'E' will be higher. That means even if the current P/E is high, it will reduce over time if the share price stays flat. So while a stock may look expensive based on past earnings, it could be cheap based on future earnings.
R22's earnings made like a rocket, taking off 60% last year. Even better, EPS is up 26% per year over three years. So you might say it really deserves to have an above-average P/E ratio.
A Limitation: P/E Ratios Ignore Debt and Cash In The Bank
It's important to note that the P/E ratio considers the market capitalization, not the enterprise value. So it won't reflect the advantage of cash, or disadvantage of debt. Hypothetically, a company could reduce its future P/E ratio by spending its cash (or taking on debt) to achieve higher earnings.
Spending on growth might be good or bad a few years later, but the point is that the P/E ratio does not account for the option (or lack thereof).
R22's Balance Sheet
R22's net debt is 24% of its market cap. This could bring some additional risk, and reduce the number of investment options for management; worth remembering if you compare its P/E to businesses without debt.
The Verdict On R22's P/E Ratio
R22 trades on a P/E ratio of 32.8, which is multiples above its market average of 10.2. The company is not overly constrained by its modest debt levels, and its recent EPS growth is nothing short of stand-out. So to be frank we are not surprised it has a high P/E ratio. What we know for sure is that investors have become much more excited about R22 recently, since they have pushed its P/E ratio from 24.1 to 32.8 over the last month. If you like to buy stocks that have recently impressed the market, then this one might be a candidate; but if you prefer to invest when there is 'blood in the streets', then you may feel the opportunity has passed.
Investors have an opportunity when market expectations about a stock are wrong. If the reality for a company is better than it expects, you can make money by buying and holding for the long term. So this free visual report on analyst forecasts could hold the key to an excellent investment decision.
Of course, you might find a fantastic investment by looking at a few good candidates. So take a peek at this free list of companies with modest (or no) debt, trading on a P/E below 20.
If you spot an error that warrants correction, please contact the editor at editorial-team@simplywallst.com. This article by Simply Wall St is general in nature. It does not constitute a recommendation to buy or sell any stock, and does not take account of your objectives, or your financial situation. Simply Wall St has no position in the stocks mentioned.
We aim to bring you long-term focused research analysis driven by fundamental data. Note that our analysis may not factor in the latest price-sensitive company announcements or qualitative material. Thank you for reading.
About WSE:CBF
Reasonable growth potential with adequate balance sheet.
Market Insights

Advertisement
Community Narratives
The company that turned a verb into a global necessity and basically runs the modern internet, digital ads, smartphones, maps, and AI.
Fair Value US$300.00|7.1% undervalued
OS
Community Contributor
Flowers Foods Pays A Fair Price For Health
Fair Value US$16.12|26.4% undervalued
NV
Community Contributor
TMX Group will thrive with 33.3% profit margin and enduring market moat
Fair Value CA$49.90|0.8% overvalued
LI
Community Contributor
The "Molecular Pencil": Why Beam's Technology is Built to Win
Fair Value US$65.01|65.8% undervalued
DA
Community Contributor