
Advertisement
- Australia
- /
- Healthcare Services
- /
- ASX:MVF
Here's What Monash IVF Group Limited's (ASX:MVF) P/E Ratio Is Telling Us
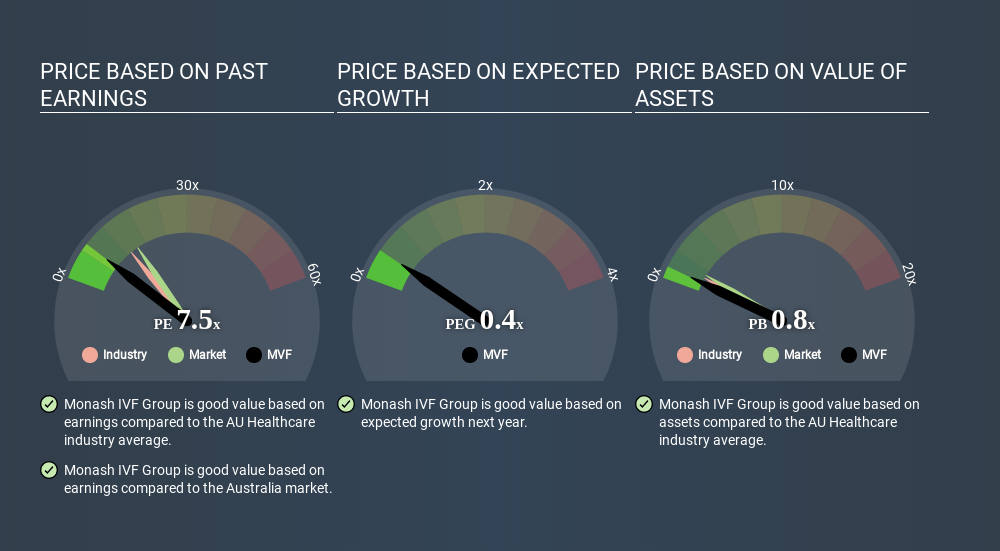
Today, we'll introduce the concept of the P/E ratio for those who are learning about investing. We'll apply a basic P/E ratio analysis to Monash IVF Group Limited's (ASX:MVF), to help you decide if the stock is worth further research. Looking at earnings over the last twelve months, Monash IVF Group has a P/E ratio of 7.52. That means that at current prices, buyers pay A$7.52 for every A$1 in trailing yearly profits.
Check out our latest analysis for Monash IVF Group
How Do You Calculate A P/E Ratio?
The formula for P/E is:
Price to Earnings Ratio = Share Price ÷ Earnings per Share (EPS)
Or for Monash IVF Group:
P/E of 7.52 = A$0.585 ÷ A$0.078 (Based on the trailing twelve months to December 2019.)
(Note: the above calculation results may not be precise due to rounding.)
Is A High Price-to-Earnings Ratio Good?
The higher the P/E ratio, the higher the price tag of a business, relative to its trailing earnings. That isn't necessarily good or bad, but a high P/E implies relatively high expectations of what a company can achieve in the future.
Does Monash IVF Group Have A Relatively High Or Low P/E For Its Industry?
The P/E ratio indicates whether the market has higher or lower expectations of a company. We can see in the image below that the average P/E (12.6) for companies in the healthcare industry is higher than Monash IVF Group's P/E.
This suggests that market participants think Monash IVF Group will underperform other companies in its industry. While current expectations are low, the stock could be undervalued if the situation is better than the market assumes. It is arguably worth checking if insiders are buying shares, because that might imply they believe the stock is undervalued.
How Growth Rates Impact P/E Ratios
If earnings fall then in the future the 'E' will be lower. That means even if the current P/E is low, it will increase over time if the share price stays flat. A higher P/E should indicate the stock is expensive relative to others -- and that may encourage shareholders to sell.
Monash IVF Group saw earnings per share decrease by 3.4% last year. But EPS is up 13% over the last 5 years. And EPS is down 15% a year, over the last 3 years. So we might expect a relatively low P/E.
A Limitation: P/E Ratios Ignore Debt and Cash In The Bank
One drawback of using a P/E ratio is that it considers market capitalization, but not the balance sheet. So it won't reflect the advantage of cash, or disadvantage of debt. Theoretically, a business can improve its earnings (and produce a lower P/E in the future) by investing in growth. That means taking on debt (or spending its cash).
Such expenditure might be good or bad, in the long term, but the point here is that the balance sheet is not reflected by this ratio.
Is Debt Impacting Monash IVF Group's P/E?
Monash IVF Group has net debt equal to 40% of its market cap. While that's enough to warrant consideration, it doesn't really concern us.
The Bottom Line On Monash IVF Group's P/E Ratio
Monash IVF Group has a P/E of 7.5. That's below the average in the AU market, which is 15.9. The debt levels are not a major concern, but the lack of EPS growth is likely weighing on sentiment.
When the market is wrong about a stock, it gives savvy investors an opportunity. If it is underestimating a company, investors can make money by buying and holding the shares until the market corrects itself. So this free visualization of the analyst consensus on future earnings could help you make the right decision about whether to buy, sell, or hold.
Of course, you might find a fantastic investment by looking at a few good candidates. So take a peek at this free list of companies with modest (or no) debt, trading on a P/E below 20.
Love or hate this article? Concerned about the content? Get in touch with us directly. Alternatively, email editorial-team@simplywallst.com.
This article by Simply Wall St is general in nature. It does not constitute a recommendation to buy or sell any stock, and does not take account of your objectives, or your financial situation. We aim to bring you long-term focused analysis driven by fundamental data. Note that our analysis may not factor in the latest price-sensitive company announcements or qualitative material. Simply Wall St has no position in any stocks mentioned. Thank you for reading.
About ASX:MVF
Monash IVF Group
Engages in the provision of assisted reproductive and specialist women imaging services in Australia and Malaysia.
Very undervalued second-rate dividend payer.
Market Insights

Advertisement
Community Narratives
The "Molecular Pencil": Why Beam's Technology is Built to Win
Fair Value US$65.01|65.4% undervalued
DA
Community Contributor
The silent giant behind virtually every advanced chip powering AI, smartphones, and modern infrastructure.
Fair Value US$310.00|6.1% undervalued
OS
Community Contributor
ADP Stock: Solid Fundamentals, But AI Investments Test Its Margin Resilience
Fair Value US$387.77|34.2% undervalued
YI
Community Contributor
MINISO's fair value is projected at 26.69 with an anticipated PE ratio shift of 20x
Fair Value US$24.03|9.6% undervalued
BE
Community Contributor