- India
- /
- Electrical
- /
- NSEI:GRAPHITE
Graphite India (NSE:GRAPHITE) Has Gifted Shareholders With A Fantastic 220% Total Return On Their Investment


The most you can lose on any stock (assuming you don't use leverage) is 100% of your money. But on the bright side, you can make far more than 100% on a really good stock. Long term Graphite India Limited (NSE:GRAPHITE) shareholders would be well aware of this, since the stock is up 166% in five years. It's even up 5.6% in the last week. But this could be related to the buoyant market which is up about 3.9% in a week.
Check out our latest analysis for Graphite India
While the efficient markets hypothesis continues to be taught by some, it has been proven that markets are over-reactive dynamic systems, and investors are not always rational. One flawed but reasonable way to assess how sentiment around a company has changed is to compare the earnings per share (EPS) with the share price.
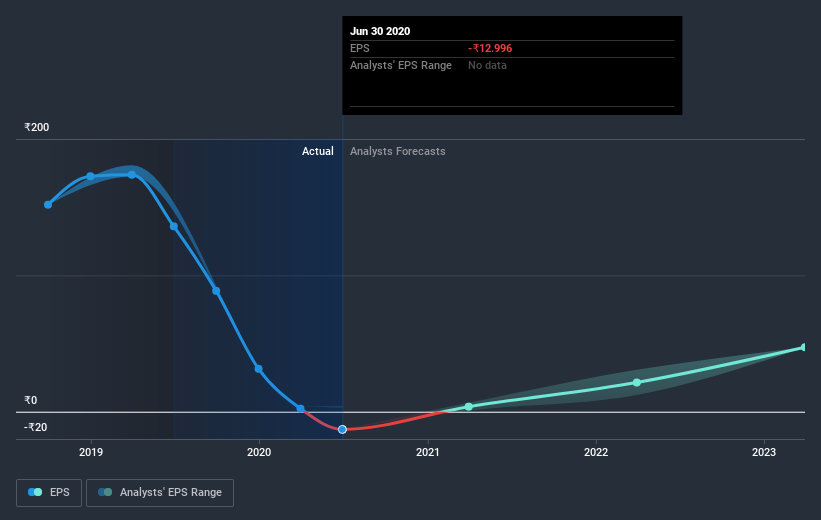
Over half a decade, Graphite India managed to grow its earnings per share at 7.8% a year. This EPS growth is slower than the share price growth of 22% per year, over the same period. So it's fair to assume the market has a higher opinion of the business than it did five years ago. And that's hardly shocking given the track record of growth.
You can see how EPS has changed over time in the image below (click on the chart to see the exact values).
It's probably worth noting that the CEO is paid less than the median at similar sized companies. It's always worth keeping an eye on CEO pay, but a more important question is whether the company will grow earnings throughout the years. It might be well worthwhile taking a look at our free report on Graphite India's earnings, revenue and cash flow.
What about the Total Shareholder Return (TSR)?
We've already covered Graphite India's share price action, but we should also mention its total shareholder return (TSR). The TSR is a return calculation that accounts for the value of cash dividends (assuming that any dividend received was reinvested) and the calculated value of any discounted capital raisings and spin-offs. Its history of dividend payouts mean that Graphite India's TSR of 220% over the last 5 years is better than the share price return.
A Different Perspective
Investors in Graphite India had a tough year, with a total loss of 44%, against a market gain of about 11%. However, keep in mind that even the best stocks will sometimes underperform the market over a twelve month period. On the bright side, long term shareholders have made money, with a gain of 26% per year over half a decade. If the fundamental data continues to indicate long term sustainable growth, the current sell-off could be an opportunity worth considering. You could get a better understanding of Graphite India's growth by checking out this more detailed historical graph of earnings, revenue and cash flow.
We will like Graphite India better if we see some big insider buys. While we wait, check out this free list of growing companies with considerable, recent, insider buying.
Please note, the market returns quoted in this article reflect the market weighted average returns of stocks that currently trade on IN exchanges.
If you decide to trade Graphite India, use the lowest-cost* platform that is rated #1 Overall by Barron’s, Interactive Brokers. Trade stocks, options, futures, forex, bonds and funds on 135 markets, all from a single integrated account. Promoted
New: Manage All Your Stock Portfolios in One Place
We've created the ultimate portfolio companion for stock investors, and it's free.
• Connect an unlimited number of Portfolios and see your total in one currency
• Be alerted to new Warning Signs or Risks via email or mobile
• Track the Fair Value of your stocks
This article by Simply Wall St is general in nature. It does not constitute a recommendation to buy or sell any stock, and does not take account of your objectives, or your financial situation. We aim to bring you long-term focused analysis driven by fundamental data. Note that our analysis may not factor in the latest price-sensitive company announcements or qualitative material. Simply Wall St has no position in any stocks mentioned.
*Interactive Brokers Rated Lowest Cost Broker by StockBrokers.com Annual Online Review 2020
Have feedback on this article? Concerned about the content? Get in touch with us directly. Alternatively, email editorial-team@simplywallst.com.
About NSEI:GRAPHITE
Graphite India
Manufactures and sells graphite electrodes, and carbon and graphite specialty products in India and internationally.
Excellent balance sheet established dividend payer.

