
Advertisement
- India
- /
- Electrical
- /
- NSEI:BHAGYANGR
Can Bhagyanagar India (NSE:BHAGYANGR) Continue To Grow Its Returns On Capital?
Did you know there are some financial metrics that can provide clues of a potential multi-bagger? One common approach is to try and find a company with returns on capital employed (ROCE) that are increasing, in conjunction with a growing amount of capital employed. Put simply, these types of businesses are compounding machines, meaning they are continually reinvesting their earnings at ever-higher rates of return. So when we looked at Bhagyanagar India (NSE:BHAGYANGR) and its trend of ROCE, we really liked what we saw.
Return On Capital Employed (ROCE): What is it?
For those who don't know, ROCE is a measure of a company's yearly pre-tax profit (its return), relative to the capital employed in the business. The formula for this calculation on Bhagyanagar India is:
Return on Capital Employed = Earnings Before Interest and Tax (EBIT) ÷ (Total Assets - Current Liabilities)
0.058 = ₹83m ÷ (₹2.0b - ₹591m) (Based on the trailing twelve months to June 2020).
Thus, Bhagyanagar India has an ROCE of 5.8%. Ultimately, that's a low return and it under-performs the Electrical industry average of 10%.
View our latest analysis for Bhagyanagar India
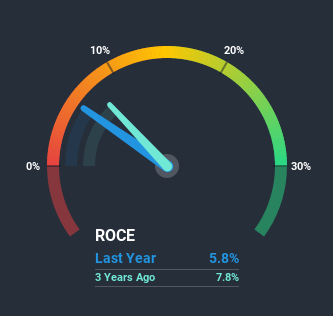
Historical performance is a great place to start when researching a stock so above you can see the gauge for Bhagyanagar India's ROCE against it's prior returns. If you'd like to look at how Bhagyanagar India has performed in the past in other metrics, you can view this free graph of past earnings, revenue and cash flow.
The Trend Of ROCE
You'd find it hard not to be impressed with the ROCE trend at Bhagyanagar India. The data shows that returns on capital have increased by 122% over the trailing five years. That's a very favorable trend because this means that the company is earning more per dollar of capital that's being employed. Speaking of capital employed, the company is actually utilizing 50% less than it was five years ago, which can be indicative of a business that's improving its efficiency. If this trend continues, the business might be getting more efficient but it's shrinking in terms of total assets.
On a side note, we noticed that the improvement in ROCE appears to be partly fueled by an increase in current liabilities. Effectively this means that suppliers or short-term creditors are now funding 29% of the business, which is more than it was five years ago. It's worth keeping an eye on this because as the percentage of current liabilities to total assets increases, some aspects of risk also increase.Our Take On Bhagyanagar India's ROCE
From what we've seen above, Bhagyanagar India has managed to increase it's returns on capital all the while reducing it's capital base. Astute investors may have an opportunity here because the stock has declined 51% in the last five years. So researching this company further and determining whether or not these trends will continue seems justified.
Since virtually every company faces some risks, it's worth knowing what they are, and we've spotted 4 warning signs for Bhagyanagar India (of which 3 don't sit too well with us!) that you should know about.
If you want to search for solid companies with great earnings, check out this free list of companies with good balance sheets and impressive returns on equity.
If you’re looking to trade Bhagyanagar India, open an account with the lowest-cost* platform trusted by professionals, Interactive Brokers. Their clients from over 200 countries and territories trade stocks, options, futures, forex, bonds and funds worldwide from a single integrated account. Promoted
Valuation is complex, but we're here to simplify it.
Discover if Bhagyanagar India might be undervalued or overvalued with our detailed analysis, featuring fair value estimates, potential risks, dividends, insider trades, and its financial condition.
Access Free AnalysisThis article by Simply Wall St is general in nature. It does not constitute a recommendation to buy or sell any stock, and does not take account of your objectives, or your financial situation. We aim to bring you long-term focused analysis driven by fundamental data. Note that our analysis may not factor in the latest price-sensitive company announcements or qualitative material. Simply Wall St has no position in any stocks mentioned.
*Interactive Brokers Rated Lowest Cost Broker by StockBrokers.com Annual Online Review 2020
Have feedback on this article? Concerned about the content? Get in touch with us directly. Alternatively, email editorial-team@simplywallst.com.
About NSEI:BHAGYANGR
Proven track record with slight risk.
Similar Companies
Market Insights

Advertisement
Community Narratives
The company that turned a verb into a global necessity and basically runs the modern internet, digital ads, smartphones, maps, and AI.
Fair Value US$300.00|7.1% undervalued
OS
Community Contributor
Flowers Foods Pays A Fair Price For Health
Fair Value US$16.12|26.4% undervalued
NV
Community Contributor
TMX Group will thrive with 33.3% profit margin and enduring market moat
Fair Value CA$49.90|0.8% overvalued
LI
Community Contributor
The "Molecular Pencil": Why Beam's Technology is Built to Win
Fair Value US$65.01|65.8% undervalued
DA
Community Contributor