Stock Analysis

We can readily understand why investors are attracted to unprofitable companies. For example, although software-as-a-service business Salesforce.com lost money for years while it grew recurring revenue, if you held shares since 2005, you'd have done very well indeed. But while the successes are well known, investors should not ignore the very many unprofitable companies that simply burn through all their cash and collapse.
So, the natural question for Imugene (ASX:IMU) shareholders is whether they should be concerned by its rate of cash burn. In this article, we define cash burn as its annual (negative) free cash flow, which is the amount of money a company spends each year to fund its growth. The first step is to compare its cash burn with its cash reserves, to give us its 'cash runway'.
View our latest analysis for Imugene
How Long Is Imugene's Cash Runway?
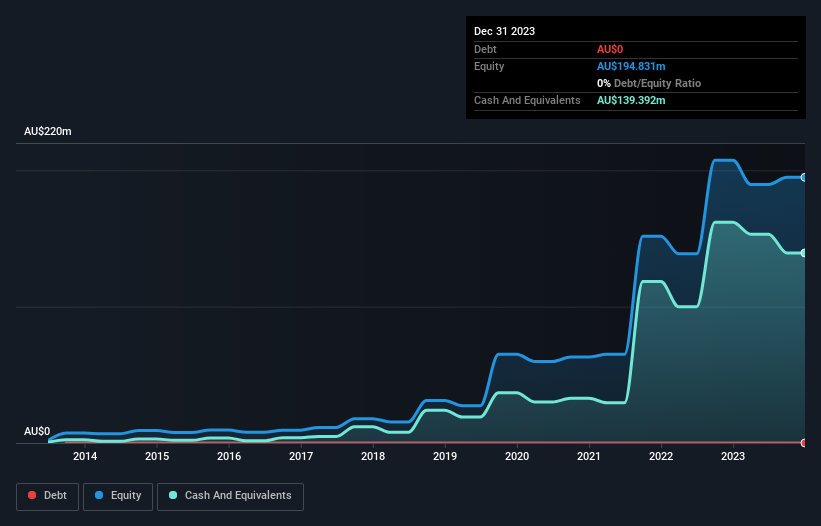
A cash runway is defined as the length of time it would take a company to run out of money if it kept spending at its current rate of cash burn. When Imugene last reported its December 2023 balance sheet in February 2024, it had zero debt and cash worth AU$139m. In the last year, its cash burn was AU$73m. So it had a cash runway of approximately 23 months from December 2023. That's not too bad, but it's fair to say the end of the cash runway is in sight, unless cash burn reduces drastically. However, if we extrapolate the company's recent cash burn trend, then it would have a longer cash run way. The image below shows how its cash balance has been changing over the last few years.
How Is Imugene's Cash Burn Changing Over Time?
While Imugene did record statutory revenue of AU$15m over the last year, it didn't have any revenue from operations. That means we consider it a pre-revenue business, and we will focus our growth analysis on cash burn, for now. During the last twelve months, its cash burn actually ramped up 74%. While this spending increase is no doubt intended to drive growth, if the trend continues the company's cash runway will shrink very quickly. Clearly, however, the crucial factor is whether the company will grow its business going forward. So you might want to take a peek at how much the company is expected to grow in the next few years.
Can Imugene Raise More Cash Easily?
Given its cash burn trajectory, Imugene shareholders may wish to consider how easily it could raise more cash, despite its solid cash runway. Issuing new shares, or taking on debt, are the most common ways for a listed company to raise more money for its business. Many companies end up issuing new shares to fund future growth. We can compare a company's cash burn to its market capitalisation to get a sense for how many new shares a company would have to issue to fund one year's operations.
Imugene has a market capitalisation of AU$673m and burnt through AU$73m last year, which is 11% of the company's market value. As a result, we'd venture that the company could raise more cash for growth without much trouble, albeit at the cost of some dilution.
So, Should We Worry About Imugene's Cash Burn?
Even though its increasing cash burn makes us a little nervous, we are compelled to mention that we thought Imugene's cash burn relative to its market cap was relatively promising. Cash burning companies are always on the riskier side of things, but after considering all of the factors discussed in this short piece, we're not too worried about its rate of cash burn. Taking an in-depth view of risks, we've identified 1 warning sign for Imugene that you should be aware of before investing.
Of course Imugene may not be the best stock to buy. So you may wish to see this free collection of companies boasting high return on equity, or this list of stocks that insiders are buying.
Valuation is complex, but we're helping make it simple.
Find out whether Imugene is potentially over or undervalued by checking out our comprehensive analysis, which includes fair value estimates, risks and warnings, dividends, insider transactions and financial health.
View the Free AnalysisHave feedback on this article? Concerned about the content? Get in touch with us directly. Alternatively, email editorial-team (at) simplywallst.com.
This article by Simply Wall St is general in nature. We provide commentary based on historical data and analyst forecasts only using an unbiased methodology and our articles are not intended to be financial advice. It does not constitute a recommendation to buy or sell any stock, and does not take account of your objectives, or your financial situation. We aim to bring you long-term focused analysis driven by fundamental data. Note that our analysis may not factor in the latest price-sensitive company announcements or qualitative material. Simply Wall St has no position in any stocks mentioned.

Simply Wall St
About ASX:IMU
Imugene
Imugene Limited, a clinical stage immuno-oncology company, develops a range of immunotherapies to activate the immune system of cancer patients to treat and eradicate tumors in Australia.
Flawless balance sheet with moderate growth potential.
