Stock Analysis


Finding a business that has the potential to grow substantially is not easy, but it is possible if we look at a few key financial metrics. Typically, we'll want to notice a trend of growing return on capital employed (ROCE) and alongside that, an expanding base of capital employed. Put simply, these types of businesses are compounding machines, meaning they are continually reinvesting their earnings at ever-higher rates of return. And in light of that, the trends we're seeing at SFD's (WSE:SFD) look very promising so lets take a look.
What Is Return On Capital Employed (ROCE)?
For those that aren't sure what ROCE is, it measures the amount of pre-tax profits a company can generate from the capital employed in its business. The formula for this calculation on SFD is:
Return on Capital Employed = Earnings Before Interest and Tax (EBIT) ÷ (Total Assets - Current Liabilities)
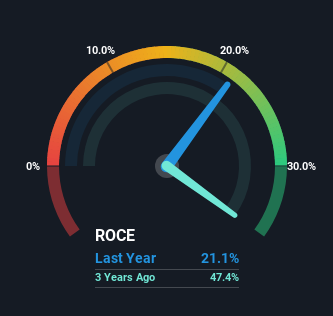
0.21 = zł11m ÷ (zł90m - zł39m) (Based on the trailing twelve months to September 2023).
Therefore, SFD has an ROCE of 21%. That's a fantastic return and not only that, it outpaces the average of 15% earned by companies in a similar industry.
Check out our latest analysis for SFD
While the past is not representative of the future, it can be helpful to know how a company has performed historically, which is why we have this chart above. If you want to delve into the historical earnings , check out these free graphs detailing revenue and cash flow performance of SFD.
What Does the ROCE Trend For SFD Tell Us?
SFD has recently broken into profitability so their prior investments seem to be paying off. Shareholders would no doubt be pleased with this because the business was loss-making five years ago but is is now generating 21% on its capital. Not only that, but the company is utilizing 237% more capital than before, but that's to be expected from a company trying to break into profitability. This can tell us that the company has plenty of reinvestment opportunities that are able to generate higher returns.
On a related note, the company's ratio of current liabilities to total assets has decreased to 44%, which basically reduces it's funding from the likes of short-term creditors or suppliers. So shareholders would be pleased that the growth in returns has mostly come from underlying business performance. However, current liabilities are still at a pretty high level, so just be aware that this can bring with it some risks.
What We Can Learn From SFD's ROCE
In summary, it's great to see that SFD has managed to break into profitability and is continuing to reinvest in its business. Since the stock has returned a staggering 403% to shareholders over the last five years, it looks like investors are recognizing these changes. Therefore, we think it would be worth your time to check if these trends are going to continue.
On a separate note, we've found 4 warning signs for SFD you'll probably want to know about.
SFD is not the only stock earning high returns. If you'd like to see more, check out our free list of companies earning high returns on equity with solid fundamentals.
Valuation is complex, but we're helping make it simple.
Find out whether SFD is potentially over or undervalued by checking out our comprehensive analysis, which includes fair value estimates, risks and warnings, dividends, insider transactions and financial health.
View the Free AnalysisHave feedback on this article? Concerned about the content? Get in touch with us directly. Alternatively, email editorial-team (at) simplywallst.com.
This article by Simply Wall St is general in nature. We provide commentary based on historical data and analyst forecasts only using an unbiased methodology and our articles are not intended to be financial advice. It does not constitute a recommendation to buy or sell any stock, and does not take account of your objectives, or your financial situation. We aim to bring you long-term focused analysis driven by fundamental data. Note that our analysis may not factor in the latest price-sensitive company announcements or qualitative material. Simply Wall St has no position in any stocks mentioned.
About WSE:SFD
SFD
SFD S.A. engages in the wholesale and retail of nutrients, dietary supplements, and sports accessories in Poland.
Excellent balance sheet second-rate dividend payer.
