Stock Analysis
- Belgium
- /
- Food and Staples Retail
- /
- ENXTBR:COLR
Those who invested in Colruyt Group (EBR:COLR) a year ago are up 65%

These days it's easy to simply buy an index fund, and your returns should (roughly) match the market. But investors can boost returns by picking market-beating companies to own shares in. To wit, the Colruyt Group N.V. (EBR:COLR) share price is 60% higher than it was a year ago, much better than the market decline of around 3.2% (not including dividends) in the same period. So that should have shareholders smiling. Unfortunately the longer term returns are not so good, with the stock falling 16% in the last three years.
With that in mind, it's worth seeing if the company's underlying fundamentals have been the driver of long term performance, or if there are some discrepancies.
Check out our latest analysis for Colruyt Group
In his essay The Superinvestors of Graham-and-Doddsville Warren Buffett described how share prices do not always rationally reflect the value of a business. One flawed but reasonable way to assess how sentiment around a company has changed is to compare the earnings per share (EPS) with the share price.
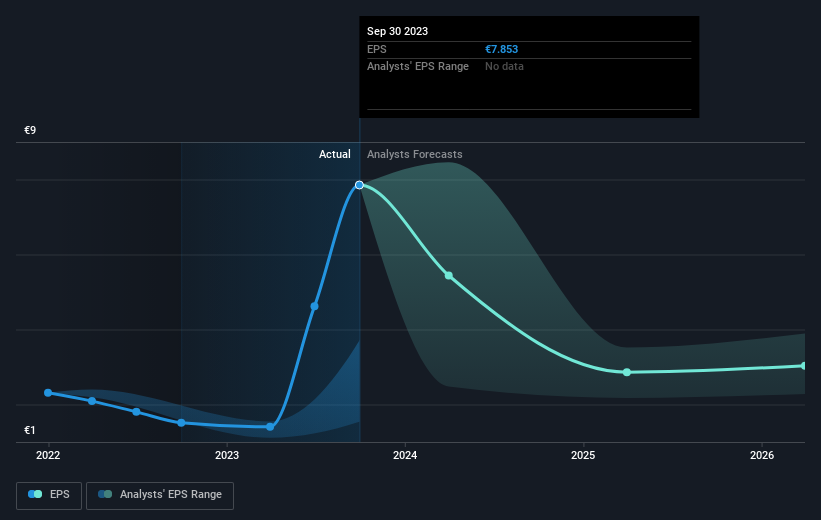
Colruyt Group boasted truly magnificent EPS growth in the last year. We don't think the exact number is a good guide to the sustainable growth rate, but we do think this sort of increase is impressive. We are not surprised the share price is up. To us, inflection points like this are the best time to take a close look at a stock.
The graphic below depicts how EPS has changed over time (unveil the exact values by clicking on the image).
We're pleased to report that the CEO is remunerated more modestly than most CEOs at similarly capitalized companies. But while CEO remuneration is always worth checking, the really important question is whether the company can grow earnings going forward. Before buying or selling a stock, we always recommend a close examination of historic growth trends, available here..
What About Dividends?
When looking at investment returns, it is important to consider the difference between total shareholder return (TSR) and share price return. The TSR incorporates the value of any spin-offs or discounted capital raisings, along with any dividends, based on the assumption that the dividends are reinvested. So for companies that pay a generous dividend, the TSR is often a lot higher than the share price return. As it happens, Colruyt Group's TSR for the last 1 year was 65%, which exceeds the share price return mentioned earlier. This is largely a result of its dividend payments!
A Different Perspective
It's nice to see that Colruyt Group shareholders have received a total shareholder return of 65% over the last year. That's including the dividend. There's no doubt those recent returns are much better than the TSR loss of 5% per year over five years. This makes us a little wary, but the business might have turned around its fortunes. I find it very interesting to look at share price over the long term as a proxy for business performance. But to truly gain insight, we need to consider other information, too. To that end, you should be aware of the 1 warning sign we've spotted with Colruyt Group .
If you like to buy stocks alongside management, then you might just love this free list of companies. (Hint: insiders have been buying them).
Please note, the market returns quoted in this article reflect the market weighted average returns of stocks that currently trade on Belgian exchanges.
Valuation is complex, but we're helping make it simple.
Find out whether Colruyt Group is potentially over or undervalued by checking out our comprehensive analysis, which includes fair value estimates, risks and warnings, dividends, insider transactions and financial health.
View the Free AnalysisHave feedback on this article? Concerned about the content? Get in touch with us directly. Alternatively, email editorial-team (at) simplywallst.com.
This article by Simply Wall St is general in nature. We provide commentary based on historical data and analyst forecasts only using an unbiased methodology and our articles are not intended to be financial advice. It does not constitute a recommendation to buy or sell any stock, and does not take account of your objectives, or your financial situation. We aim to bring you long-term focused analysis driven by fundamental data. Note that our analysis may not factor in the latest price-sensitive company announcements or qualitative material. Simply Wall St has no position in any stocks mentioned.

Simply Wall St
About ENXTBR:COLR
Colruyt Group
Colruyt Group N.V., together with its subsidiaries, engages in the retail, wholesale, food service, and other activities in Belgium, France, Luxembourg, and internationally.
Outstanding track record with adequate balance sheet.
