Stock Analysis
- Belgium
- /
- Electrical
- /
- ENXTBR:CENER
These 4 Measures Indicate That Cenergy Holdings (EBR:CENER) Is Using Debt Extensively
Some say volatility, rather than debt, is the best way to think about risk as an investor, but Warren Buffett famously said that 'Volatility is far from synonymous with risk.' It's only natural to consider a company's balance sheet when you examine how risky it is, since debt is often involved when a business collapses. We can see that Cenergy Holdings SA (EBR:CENER) does use debt in its business. But is this debt a concern to shareholders?
Why Does Debt Bring Risk?
Generally speaking, debt only becomes a real problem when a company can't easily pay it off, either by raising capital or with its own cash flow. Part and parcel of capitalism is the process of 'creative destruction' where failed businesses are mercilessly liquidated by their bankers. However, a more frequent (but still costly) occurrence is where a company must issue shares at bargain-basement prices, permanently diluting shareholders, just to shore up its balance sheet. Of course, the upside of debt is that it often represents cheap capital, especially when it replaces dilution in a company with the ability to reinvest at high rates of return. When we think about a company's use of debt, we first look at cash and debt together.
Check out our latest analysis for Cenergy Holdings
How Much Debt Does Cenergy Holdings Carry?
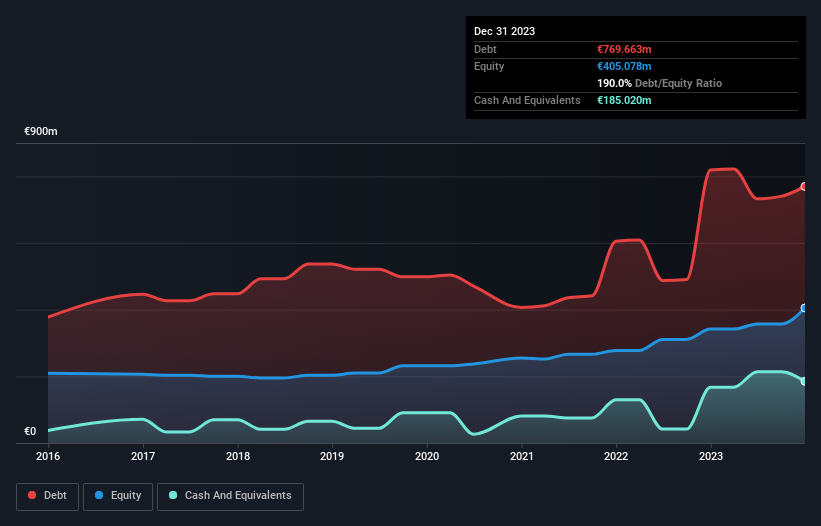
The image below, which you can click on for greater detail, shows that Cenergy Holdings had debt of €769.7m at the end of December 2023, a reduction from €818.9m over a year. On the flip side, it has €185.0m in cash leading to net debt of about €584.6m.
A Look At Cenergy Holdings' Liabilities
We can see from the most recent balance sheet that Cenergy Holdings had liabilities of €1.15b falling due within a year, and liabilities of €288.3m due beyond that. On the other hand, it had cash of €185.0m and €479.3m worth of receivables due within a year. So it has liabilities totalling €769.8m more than its cash and near-term receivables, combined.
Cenergy Holdings has a market capitalization of €1.33b, so it could very likely raise cash to ameliorate its balance sheet, if the need arose. However, it is still worthwhile taking a close look at its ability to pay off debt.
In order to size up a company's debt relative to its earnings, we calculate its net debt divided by its earnings before interest, tax, depreciation, and amortization (EBITDA) and its earnings before interest and tax (EBIT) divided by its interest expense (its interest cover). This way, we consider both the absolute quantum of the debt, as well as the interest rates paid on it.
While we wouldn't worry about Cenergy Holdings's net debt to EBITDA ratio of 2.9, we think its super-low interest cover of 2.4 times is a sign of high leverage. It seems clear that the cost of borrowing money is negatively impacting returns for shareholders, of late. Looking on the bright side, Cenergy Holdings boosted its EBIT by a silky 68% in the last year. Like the milk of human kindness that sort of growth increases resilience, making the company more capable of managing debt. The balance sheet is clearly the area to focus on when you are analysing debt. But it is future earnings, more than anything, that will determine Cenergy Holdings's ability to maintain a healthy balance sheet going forward. So if you're focused on the future you can check out this free report showing analyst profit forecasts.
Finally, a business needs free cash flow to pay off debt; accounting profits just don't cut it. So the logical step is to look at the proportion of that EBIT that is matched by actual free cash flow. Considering the last three years, Cenergy Holdings actually recorded a cash outflow, overall. Debt is far more risky for companies with unreliable free cash flow, so shareholders should be hoping that the past expenditure will produce free cash flow in the future.
Our View
Cenergy Holdings's conversion of EBIT to free cash flow and interest cover definitely weigh on it, in our esteem. But the good news is it seems to be able to grow its EBIT with ease. When we consider all the factors discussed, it seems to us that Cenergy Holdings is taking some risks with its use of debt. So while that leverage does boost returns on equity, we wouldn't really want to see it increase from here. When analysing debt levels, the balance sheet is the obvious place to start. But ultimately, every company can contain risks that exist outside of the balance sheet. For instance, we've identified 1 warning sign for Cenergy Holdings that you should be aware of.
If you're interested in investing in businesses that can grow profits without the burden of debt, then check out this free list of growing businesses that have net cash on the balance sheet.
Valuation is complex, but we're helping make it simple.
Find out whether Cenergy Holdings is potentially over or undervalued by checking out our comprehensive analysis, which includes fair value estimates, risks and warnings, dividends, insider transactions and financial health.
View the Free AnalysisHave feedback on this article? Concerned about the content? Get in touch with us directly. Alternatively, email editorial-team (at) simplywallst.com.
This article by Simply Wall St is general in nature. We provide commentary based on historical data and analyst forecasts only using an unbiased methodology and our articles are not intended to be financial advice. It does not constitute a recommendation to buy or sell any stock, and does not take account of your objectives, or your financial situation. We aim to bring you long-term focused analysis driven by fundamental data. Note that our analysis may not factor in the latest price-sensitive company announcements or qualitative material. Simply Wall St has no position in any stocks mentioned.

Simply Wall St
About ENXTBR:CENER
Cenergy Holdings
Cenergy Holdings SA manufactures and sells aluminum, copper, cables, steel and steel pipes, and other related products in Belgium and internationally.
High growth potential with proven track record.
