Stock Analysis


What trends should we look for it we want to identify stocks that can multiply in value over the long term? Typically, we'll want to notice a trend of growing return on capital employed (ROCE) and alongside that, an expanding base of capital employed. Ultimately, this demonstrates that it's a business that is reinvesting profits at increasing rates of return. With that in mind, we've noticed some promising trends at AnAn International (SGX:Y35) so let's look a bit deeper.
Return On Capital Employed (ROCE): What Is It?
For those who don't know, ROCE is a measure of a company's yearly pre-tax profit (its return), relative to the capital employed in the business. The formula for this calculation on AnAn International is:
Return on Capital Employed = Earnings Before Interest and Tax (EBIT) ÷ (Total Assets - Current Liabilities)
0.099 = US$20m ÷ (US$560m - US$355m) (Based on the trailing twelve months to December 2023).
Thus, AnAn International has an ROCE of 9.9%. In absolute terms, that's a low return, but it's much better than the Oil and Gas industry average of 6.9%.
Check out our latest analysis for AnAn International
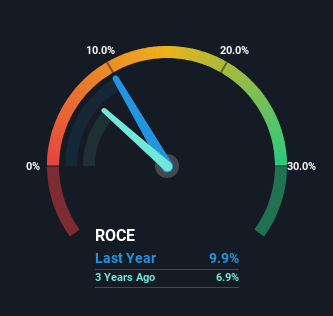
Historical performance is a great place to start when researching a stock so above you can see the gauge for AnAn International's ROCE against it's prior returns. If you'd like to look at how AnAn International has performed in the past in other metrics, you can view this free graph of AnAn International's past earnings, revenue and cash flow.
What Does the ROCE Trend For AnAn International Tell Us?
AnAn International has recently broken into profitability so their prior investments seem to be paying off. The company was generating losses five years ago, but now it's earning 9.9% which is a sight for sore eyes. Not only that, but the company is utilizing 77% more capital than before, but that's to be expected from a company trying to break into profitability. We like this trend, because it tells us the company has profitable reinvestment opportunities available to it, and if it continues going forward that can lead to a multi-bagger performance.
Another thing to note, AnAn International has a high ratio of current liabilities to total assets of 63%. This effectively means that suppliers (or short-term creditors) are funding a large portion of the business, so just be aware that this can introduce some elements of risk. While it's not necessarily a bad thing, it can be beneficial if this ratio is lower.
What We Can Learn From AnAn International's ROCE
In summary, it's great to see that AnAn International has managed to break into profitability and is continuing to reinvest in its business. Since the stock has returned a solid 100% to shareholders over the last five years, it's fair to say investors are beginning to recognize these changes. Therefore, we think it would be worth your time to check if these trends are going to continue.
Since virtually every company faces some risks, it's worth knowing what they are, and we've spotted 4 warning signs for AnAn International (of which 2 are potentially serious!) that you should know about.
While AnAn International may not currently earn the highest returns, we've compiled a list of companies that currently earn more than 25% return on equity. Check out this free list here.
Valuation is complex, but we're helping make it simple.
Find out whether AnAn International is potentially over or undervalued by checking out our comprehensive analysis, which includes fair value estimates, risks and warnings, dividends, insider transactions and financial health.
View the Free AnalysisHave feedback on this article? Concerned about the content? Get in touch with us directly. Alternatively, email editorial-team (at) simplywallst.com.
This article by Simply Wall St is general in nature. We provide commentary based on historical data and analyst forecasts only using an unbiased methodology and our articles are not intended to be financial advice. It does not constitute a recommendation to buy or sell any stock, and does not take account of your objectives, or your financial situation. We aim to bring you long-term focused analysis driven by fundamental data. Note that our analysis may not factor in the latest price-sensitive company announcements or qualitative material. Simply Wall St has no position in any stocks mentioned.
About SGX:Y35
AnAn International
AnAn International Limited, an investment holding company, trades in petrochemical, fuel oil, and petroleum products in Singapore and internationally.
Mediocre balance sheet and slightly overvalued.
