Stock Analysis
- United States
- /
- Building
- /
- NYSE:IIIN
The five-year decline in earnings for Insteel Industries NYSE:IIIN) isn't encouraging, but shareholders are still up 120% over that period
These days it's easy to simply buy an index fund, and your returns should (roughly) match the market. But in our experience, buying the right stocks can give your wealth a significant boost. For example, the Insteel Industries, Inc. (NYSE:IIIN) share price is 67% higher than it was five years ago, which is more than the market average. It's also good to see that the stock is up 19% in a year.
Since the long term performance has been good but there's been a recent pullback of 8.7%, let's check if the fundamentals match the share price.
Check out our latest analysis for Insteel Industries
While markets are a powerful pricing mechanism, share prices reflect investor sentiment, not just underlying business performance. By comparing earnings per share (EPS) and share price changes over time, we can get a feel for how investor attitudes to a company have morphed over time.
During five years of share price growth, Insteel Industries actually saw its EPS drop 7.3% per year.
This means it's unlikely the market is judging the company based on earnings growth. Since the change in EPS doesn't seem to correlate with the change in share price, it's worth taking a look at other metrics.
We doubt the modest 0.4% dividend yield is attracting many buyers to the stock. On the other hand, Insteel Industries' revenue is growing nicely, at a compound rate of 12% over the last five years. It's quite possible that management are prioritizing revenue growth over EPS growth at the moment.
You can see below how earnings and revenue have changed over time (discover the exact values by clicking on the image).
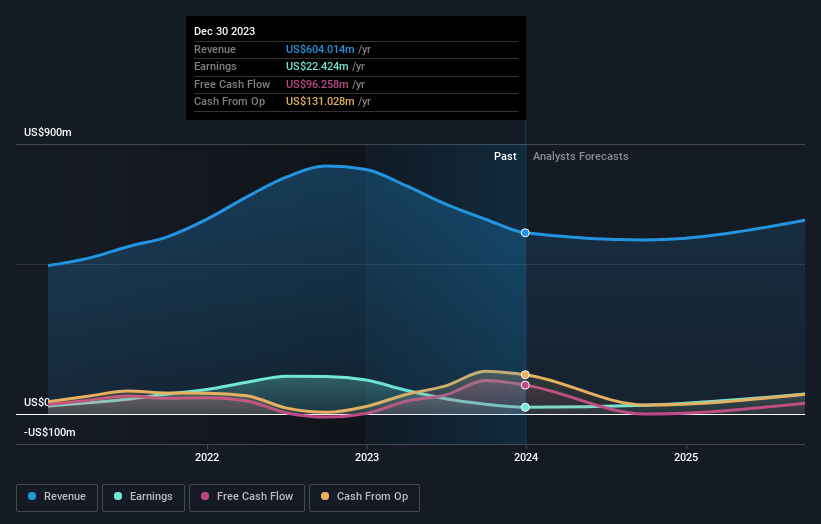
Take a more thorough look at Insteel Industries' financial health with this free report on its balance sheet.
What About Dividends?
When looking at investment returns, it is important to consider the difference between total shareholder return (TSR) and share price return. The TSR incorporates the value of any spin-offs or discounted capital raisings, along with any dividends, based on the assumption that the dividends are reinvested. Arguably, the TSR gives a more comprehensive picture of the return generated by a stock. In the case of Insteel Industries, it has a TSR of 120% for the last 5 years. That exceeds its share price return that we previously mentioned. This is largely a result of its dividend payments!
A Different Perspective
We're pleased to report that Insteel Industries shareholders have received a total shareholder return of 29% over one year. And that does include the dividend. Since the one-year TSR is better than the five-year TSR (the latter coming in at 17% per year), it would seem that the stock's performance has improved in recent times. Someone with an optimistic perspective could view the recent improvement in TSR as indicating that the business itself is getting better with time. It's always interesting to track share price performance over the longer term. But to understand Insteel Industries better, we need to consider many other factors. To that end, you should be aware of the 1 warning sign we've spotted with Insteel Industries .
We will like Insteel Industries better if we see some big insider buys. While we wait, check out this free list of growing companies with considerable, recent, insider buying.
Please note, the market returns quoted in this article reflect the market weighted average returns of stocks that currently trade on American exchanges.
Valuation is complex, but we're helping make it simple.
Find out whether Insteel Industries is potentially over or undervalued by checking out our comprehensive analysis, which includes fair value estimates, risks and warnings, dividends, insider transactions and financial health.
View the Free AnalysisHave feedback on this article? Concerned about the content? Get in touch with us directly. Alternatively, email editorial-team (at) simplywallst.com.
This article by Simply Wall St is general in nature. We provide commentary based on historical data and analyst forecasts only using an unbiased methodology and our articles are not intended to be financial advice. It does not constitute a recommendation to buy or sell any stock, and does not take account of your objectives, or your financial situation. We aim to bring you long-term focused analysis driven by fundamental data. Note that our analysis may not factor in the latest price-sensitive company announcements or qualitative material. Simply Wall St has no position in any stocks mentioned.

Simply Wall St
About NYSE:IIIN
Insteel Industries
Insteel Industries, Inc., together with its subsidiaries, manufactures and markets steel wire reinforcing products for concrete construction applications.
Flawless balance sheet with moderate growth potential.
