Stock Analysis
- Australia
- /
- Specialty Stores
- /
- ASX:TPW
Temple & Webster Group's (ASX:TPW) earnings growth rate lags the 49% CAGR delivered to shareholders

Temple & Webster Group Ltd (ASX:TPW) shareholders might be concerned after seeing the share price drop 11% in the last month. But that doesn't change the fact that the returns over the last half decade have been spectacular. In fact, during that period, the share price climbed 646%. Impressive! So we don't think the recent decline in the share price means its story is a sad one. Only time will tell if there is still too much optimism currently reflected in the share price. It really delights us to see such great share price performance for investors.
Since the long term performance has been good but there's been a recent pullback of 7.7%, let's check if the fundamentals match the share price.
See our latest analysis for Temple & Webster Group
There is no denying that markets are sometimes efficient, but prices do not always reflect underlying business performance. One flawed but reasonable way to assess how sentiment around a company has changed is to compare the earnings per share (EPS) with the share price.
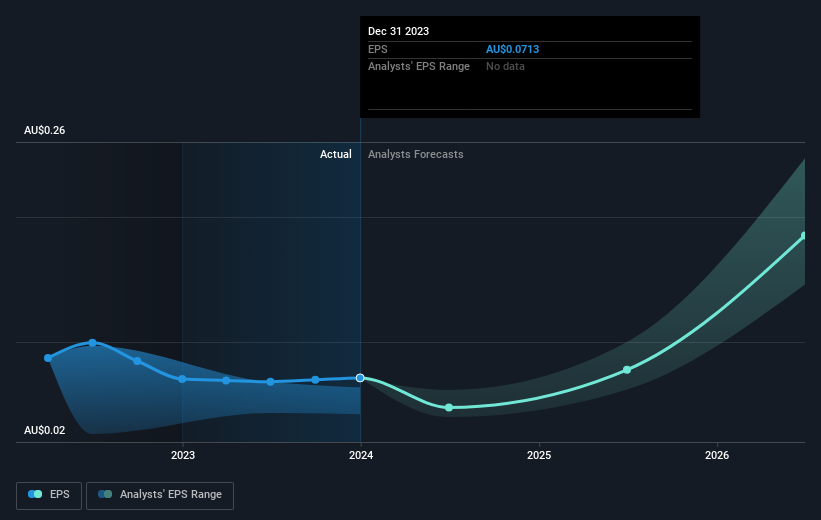
Over half a decade, Temple & Webster Group managed to grow its earnings per share at 15% a year. This EPS growth is slower than the share price growth of 49% per year, over the same period. This suggests that market participants hold the company in higher regard, these days. That's not necessarily surprising considering the five-year track record of earnings growth. This optimism is visible in its fairly high P/E ratio of 158.85.
You can see how EPS has changed over time in the image below (click on the chart to see the exact values).
It might be well worthwhile taking a look at our free report on Temple & Webster Group's earnings, revenue and cash flow.
A Different Perspective
We're pleased to report that Temple & Webster Group shareholders have received a total shareholder return of 177% over one year. That's better than the annualised return of 49% over half a decade, implying that the company is doing better recently. Given the share price momentum remains strong, it might be worth taking a closer look at the stock, lest you miss an opportunity. It's always interesting to track share price performance over the longer term. But to understand Temple & Webster Group better, we need to consider many other factors. Take risks, for example - Temple & Webster Group has 1 warning sign we think you should be aware of.
We will like Temple & Webster Group better if we see some big insider buys. While we wait, check out this free list of growing companies with considerable, recent, insider buying.
Please note, the market returns quoted in this article reflect the market weighted average returns of stocks that currently trade on Australian exchanges.
Valuation is complex, but we're helping make it simple.
Find out whether Temple & Webster Group is potentially over or undervalued by checking out our comprehensive analysis, which includes fair value estimates, risks and warnings, dividends, insider transactions and financial health.
View the Free AnalysisHave feedback on this article? Concerned about the content? Get in touch with us directly. Alternatively, email editorial-team (at) simplywallst.com.
This article by Simply Wall St is general in nature. We provide commentary based on historical data and analyst forecasts only using an unbiased methodology and our articles are not intended to be financial advice. It does not constitute a recommendation to buy or sell any stock, and does not take account of your objectives, or your financial situation. We aim to bring you long-term focused analysis driven by fundamental data. Note that our analysis may not factor in the latest price-sensitive company announcements or qualitative material. Simply Wall St has no position in any stocks mentioned.

Simply Wall St
About ASX:TPW
Temple & Webster Group
Temple & Webster Group Ltd engages in the online retail of furniture, homewares, and home improvement products in Australia.
Flawless balance sheet with reasonable growth potential.
