Stock Analysis
- Sweden
- /
- Specialty Stores
- /
- OM:RIZZO B
Rizzo Group AB (publ)'s (STO:RIZZO B) Popularity With Investors Under Threat As Stock Sinks 49%

Unfortunately for some shareholders, the Rizzo Group AB (publ) (STO:RIZZO B) share price has dived 49% in the last thirty days, prolonging recent pain. The recent drop completes a disastrous twelve months for shareholders, who are sitting on a 77% loss during that time.
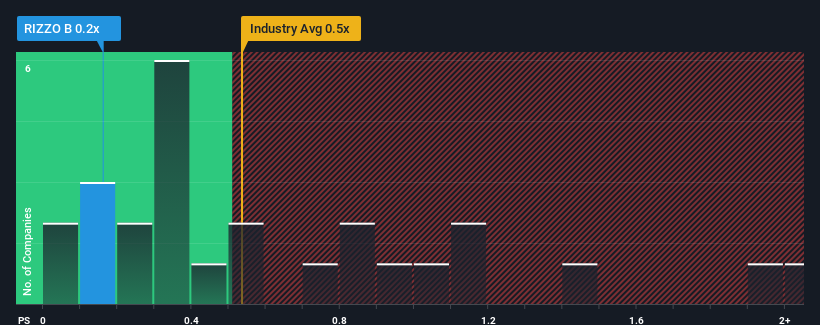
Even after such a large drop in price, it's still not a stretch to say that Rizzo Group's price-to-sales (or "P/S") ratio of 0.2x right now seems quite "middle-of-the-road" compared to the Specialty Retail industry in Sweden, where the median P/S ratio is around 0.5x. However, investors might be overlooking a clear opportunity or potential setback if there is no rational basis for the P/S.
Check out our latest analysis for Rizzo Group
What Does Rizzo Group's Recent Performance Look Like?
As an illustration, revenue has deteriorated at Rizzo Group over the last year, which is not ideal at all. One possibility is that the P/S is moderate because investors think the company might still do enough to be in line with the broader industry in the near future. If you like the company, you'd at least be hoping this is the case so that you could potentially pick up some stock while it's not quite in favour.
Although there are no analyst estimates available for Rizzo Group, take a look at this free data-rich visualisation to see how the company stacks up on earnings, revenue and cash flow.What Are Revenue Growth Metrics Telling Us About The P/S?
The only time you'd be comfortable seeing a P/S like Rizzo Group's is when the company's growth is tracking the industry closely.
Retrospectively, the last year delivered a frustrating 24% decrease to the company's top line. The last three years don't look nice either as the company has shrunk revenue by 61% in aggregate. Therefore, it's fair to say the revenue growth recently has been undesirable for the company.
Comparing that to the industry, which is predicted to deliver 3.7% growth in the next 12 months, the company's downward momentum based on recent medium-term revenue results is a sobering picture.
With this information, we find it concerning that Rizzo Group is trading at a fairly similar P/S compared to the industry. It seems most investors are ignoring the recent poor growth rate and are hoping for a turnaround in the company's business prospects. There's a good chance existing shareholders are setting themselves up for future disappointment if the P/S falls to levels more in line with the recent negative growth rates.
The Final Word
Rizzo Group's plummeting stock price has brought its P/S back to a similar region as the rest of the industry. Typically, we'd caution against reading too much into price-to-sales ratios when settling on investment decisions, though it can reveal plenty about what other market participants think about the company.
Our look at Rizzo Group revealed its shrinking revenues over the medium-term haven't impacted the P/S as much as we anticipated, given the industry is set to grow. When we see revenue heading backwards in the context of growing industry forecasts, it'd make sense to expect a possible share price decline on the horizon, sending the moderate P/S lower. If recent medium-term revenue trends continue, it will place shareholders' investments at risk and potential investors in danger of paying an unnecessary premium.
There are also other vital risk factors to consider before investing and we've discovered 6 warning signs for Rizzo Group that you should be aware of.
If companies with solid past earnings growth is up your alley, you may wish to see this free collection of other companies with strong earnings growth and low P/E ratios.
Valuation is complex, but we're helping make it simple.
Find out whether Rizzo Group is potentially over or undervalued by checking out our comprehensive analysis, which includes fair value estimates, risks and warnings, dividends, insider transactions and financial health.
View the Free AnalysisHave feedback on this article? Concerned about the content? Get in touch with us directly. Alternatively, email editorial-team (at) simplywallst.com.
This article by Simply Wall St is general in nature. We provide commentary based on historical data and analyst forecasts only using an unbiased methodology and our articles are not intended to be financial advice. It does not constitute a recommendation to buy or sell any stock, and does not take account of your objectives, or your financial situation. We aim to bring you long-term focused analysis driven by fundamental data. Note that our analysis may not factor in the latest price-sensitive company announcements or qualitative material. Simply Wall St has no position in any stocks mentioned.

Simply Wall St
About OM:RIZZO B
Rizzo Group
Rizzo Group AB (publ) offers bags, accessories, and travel accessories.
Slightly overvalued with weak fundamentals.
