Stock Analysis
Rhythm Co.,Ltd.'s (TSE:7769) 30% Dip Still Leaving Some Shareholders Feeling Restless Over Its P/SRatio


The Rhythm Co.,Ltd. (TSE:7769) share price has softened a substantial 30% over the previous 30 days, handing back much of the gains the stock has made lately. Still, a bad month hasn't completely ruined the past year with the stock gaining 53%, which is great even in a bull market.
In spite of the heavy fall in price, you could still be forgiven for feeling indifferent about RhythmLtd's P/S ratio of 0.8x, since the median price-to-sales (or "P/S") ratio for the Luxury industry in Japan is also close to 0.6x. However, investors might be overlooking a clear opportunity or potential setback if there is no rational basis for the P/S.
Check out our latest analysis for RhythmLtd
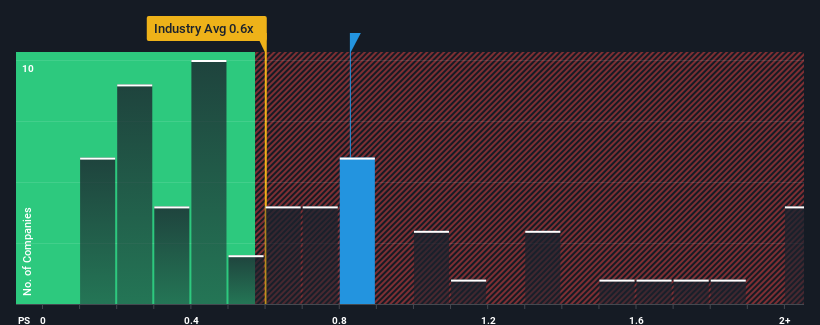
How RhythmLtd Has Been Performing
As an illustration, revenue has deteriorated at RhythmLtd over the last year, which is not ideal at all. One possibility is that the P/S is moderate because investors think the company might still do enough to be in line with the broader industry in the near future. If not, then existing shareholders may be a little nervous about the viability of the share price.
Want the full picture on earnings, revenue and cash flow for the company? Then our free report on RhythmLtd will help you shine a light on its historical performance.Do Revenue Forecasts Match The P/S Ratio?
RhythmLtd's P/S ratio would be typical for a company that's only expected to deliver moderate growth, and importantly, perform in line with the industry.
In reviewing the last year of financials, we were disheartened to see the company's revenues fell to the tune of 5.6%. That put a dampener on the good run it was having over the longer-term as its three-year revenue growth is still a noteworthy 13% in total. Although it's been a bumpy ride, it's still fair to say the revenue growth recently has been mostly respectable for the company.
Comparing that to the industry, which is predicted to deliver 6.4% growth in the next 12 months, the company's momentum is weaker, based on recent medium-term annualised revenue results.
With this in mind, we find it intriguing that RhythmLtd's P/S is comparable to that of its industry peers. It seems most investors are ignoring the fairly limited recent growth rates and are willing to pay up for exposure to the stock. Maintaining these prices will be difficult to achieve as a continuation of recent revenue trends is likely to weigh down the shares eventually.
The Final Word
RhythmLtd's plummeting stock price has brought its P/S back to a similar region as the rest of the industry. Using the price-to-sales ratio alone to determine if you should sell your stock isn't sensible, however it can be a practical guide to the company's future prospects.
We've established that RhythmLtd's average P/S is a bit surprising since its recent three-year growth is lower than the wider industry forecast. Right now we are uncomfortable with the P/S as this revenue performance isn't likely to support a more positive sentiment for long. If recent medium-term revenue trends continue, the probability of a share price decline will become quite substantial, placing shareholders at risk.
Before you take the next step, you should know about the 3 warning signs for RhythmLtd that we have uncovered.
It's important to make sure you look for a great company, not just the first idea you come across. So if growing profitability aligns with your idea of a great company, take a peek at this free list of interesting companies with strong recent earnings growth (and a low P/E).
Valuation is complex, but we're helping make it simple.
Find out whether RhythmLtd is potentially over or undervalued by checking out our comprehensive analysis, which includes fair value estimates, risks and warnings, dividends, insider transactions and financial health.
View the Free AnalysisHave feedback on this article? Concerned about the content? Get in touch with us directly. Alternatively, email editorial-team (at) simplywallst.com.
This article by Simply Wall St is general in nature. We provide commentary based on historical data and analyst forecasts only using an unbiased methodology and our articles are not intended to be financial advice. It does not constitute a recommendation to buy or sell any stock, and does not take account of your objectives, or your financial situation. We aim to bring you long-term focused analysis driven by fundamental data. Note that our analysis may not factor in the latest price-sensitive company announcements or qualitative material. Simply Wall St has no position in any stocks mentioned.
About TSE:7769
Excellent balance sheet second-rate dividend payer.
