Stock Analysis
- Hong Kong
- /
- Paper and Forestry Products
- /
- SEHK:94
Revenues Not Telling The Story For Greenheart Group Limited (HKG:94) After Shares Rise 28%

Greenheart Group Limited (HKG:94) shares have continued their recent momentum with a 28% gain in the last month alone. Not all shareholders will be feeling jubilant, since the share price is still down a very disappointing 21% in the last twelve months.
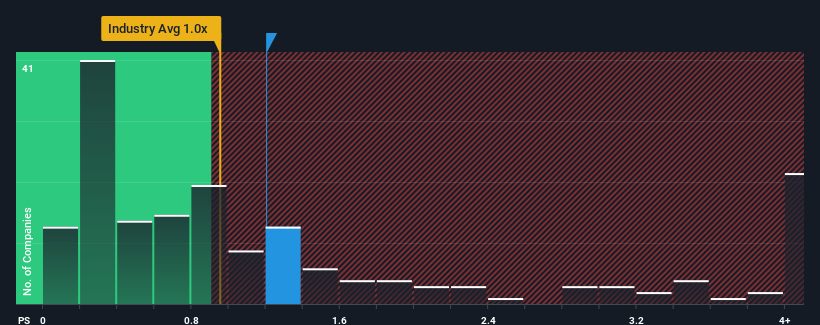
After such a large jump in price, when almost half of the companies in Hong Kong's Forestry industry have price-to-sales ratios (or "P/S") below 0.6x, you may consider Greenheart Group as a stock probably not worth researching with its 1.2x P/S ratio. Nonetheless, we'd need to dig a little deeper to determine if there is a rational basis for the elevated P/S.
View our latest analysis for Greenheart Group
How Greenheart Group Has Been Performing
As an illustration, revenue has deteriorated at Greenheart Group over the last year, which is not ideal at all. It might be that many expect the company to still outplay most other companies over the coming period, which has kept the P/S from collapsing. However, if this isn't the case, investors might get caught out paying too much for the stock.
Want the full picture on earnings, revenue and cash flow for the company? Then our free report on Greenheart Group will help you shine a light on its historical performance.What Are Revenue Growth Metrics Telling Us About The High P/S?
There's an inherent assumption that a company should outperform the industry for P/S ratios like Greenheart Group's to be considered reasonable.
Retrospectively, the last year delivered a frustrating 45% decrease to the company's top line. This means it has also seen a slide in revenue over the longer-term as revenue is down 72% in total over the last three years. So unfortunately, we have to acknowledge that the company has not done a great job of growing revenue over that time.
In contrast to the company, the rest of the industry is expected to grow by 12% over the next year, which really puts the company's recent medium-term revenue decline into perspective.
With this in mind, we find it worrying that Greenheart Group's P/S exceeds that of its industry peers. Apparently many investors in the company are way more bullish than recent times would indicate and aren't willing to let go of their stock at any price. There's a very good chance existing shareholders are setting themselves up for future disappointment if the P/S falls to levels more in line with the recent negative growth rates.
What Does Greenheart Group's P/S Mean For Investors?
Greenheart Group shares have taken a big step in a northerly direction, but its P/S is elevated as a result. While the price-to-sales ratio shouldn't be the defining factor in whether you buy a stock or not, it's quite a capable barometer of revenue expectations.
We've established that Greenheart Group currently trades on a much higher than expected P/S since its recent revenues have been in decline over the medium-term. Right now we aren't comfortable with the high P/S as this revenue performance is highly unlikely to support such positive sentiment for long. Should recent medium-term revenue trends persist, it would pose a significant risk to existing shareholders' investments and prospective investors will have a hard time accepting the current value of the stock.
There are also other vital risk factors to consider before investing and we've discovered 2 warning signs for Greenheart Group that you should be aware of.
Of course, profitable companies with a history of great earnings growth are generally safer bets. So you may wish to see this free collection of other companies that have reasonable P/E ratios and have grown earnings strongly.
Valuation is complex, but we're helping make it simple.
Find out whether Greenheart Group is potentially over or undervalued by checking out our comprehensive analysis, which includes fair value estimates, risks and warnings, dividends, insider transactions and financial health.
View the Free AnalysisHave feedback on this article? Concerned about the content? Get in touch with us directly. Alternatively, email editorial-team (at) simplywallst.com.
This article by Simply Wall St is general in nature. We provide commentary based on historical data and analyst forecasts only using an unbiased methodology and our articles are not intended to be financial advice. It does not constitute a recommendation to buy or sell any stock, and does not take account of your objectives, or your financial situation. We aim to bring you long-term focused analysis driven by fundamental data. Note that our analysis may not factor in the latest price-sensitive company announcements or qualitative material. Simply Wall St has no position in any stocks mentioned.

Simply Wall St
About SEHK:94
Greenheart Group
Greenheart Group Limited, an investment holding company, engages in forestry business worldwide.
Overvalued with worrying balance sheet.
