Stock Analysis
- Hong Kong
- /
- Industrials
- /
- SEHK:274
Renaissance Asia Silk Road Group Limited (HKG:274) Might Not Be As Mispriced As It Looks After Plunging 26%

The Renaissance Asia Silk Road Group Limited (HKG:274) share price has softened a substantial 26% over the previous 30 days, handing back much of the gains the stock has made lately. The recent drop completes a disastrous twelve months for shareholders, who are sitting on a 66% loss during that time.
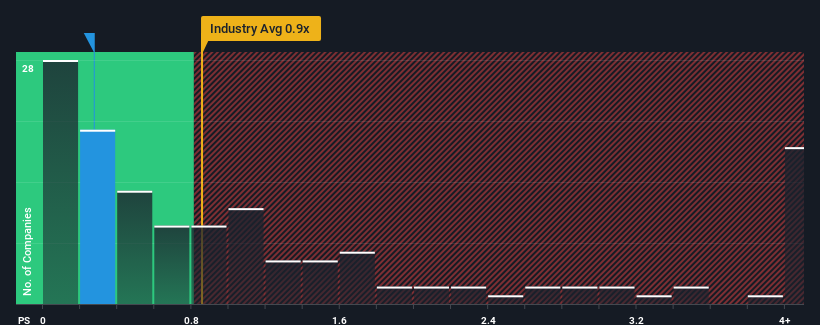
In spite of the heavy fall in price, you could still be forgiven for feeling indifferent about Renaissance Asia Silk Road Group's P/S ratio of 0.3x, since the median price-to-sales (or "P/S") ratio for the Industrials industry in Hong Kong is about the same. While this might not raise any eyebrows, if the P/S ratio is not justified investors could be missing out on a potential opportunity or ignoring looming disappointment.
View our latest analysis for Renaissance Asia Silk Road Group
How Has Renaissance Asia Silk Road Group Performed Recently?
Recent times have been quite advantageous for Renaissance Asia Silk Road Group as its revenue has been rising very briskly. It might be that many expect the strong revenue performance to wane, which has kept the share price, and thus the P/S ratio, from rising. If you like the company, you'd be hoping this isn't the case so that you could potentially pick up some stock while it's not quite in favour.
Although there are no analyst estimates available for Renaissance Asia Silk Road Group, take a look at this free data-rich visualisation to see how the company stacks up on earnings, revenue and cash flow.Do Revenue Forecasts Match The P/S Ratio?
In order to justify its P/S ratio, Renaissance Asia Silk Road Group would need to produce growth that's similar to the industry.
If we review the last year of revenue growth, the company posted a terrific increase of 67%. The latest three year period has also seen an incredible overall rise in revenue, aided by its incredible short-term performance. Therefore, it's fair to say the revenue growth recently has been superb for the company.
When compared to the industry's one-year growth forecast of 8.9%, the most recent medium-term revenue trajectory is noticeably more alluring
In light of this, it's curious that Renaissance Asia Silk Road Group's P/S sits in line with the majority of other companies. It may be that most investors are not convinced the company can maintain its recent growth rates.
What Does Renaissance Asia Silk Road Group's P/S Mean For Investors?
Renaissance Asia Silk Road Group's plummeting stock price has brought its P/S back to a similar region as the rest of the industry. It's argued the price-to-sales ratio is an inferior measure of value within certain industries, but it can be a powerful business sentiment indicator.
We've established that Renaissance Asia Silk Road Group currently trades on a lower than expected P/S since its recent three-year growth is higher than the wider industry forecast. It'd be fair to assume that potential risks the company faces could be the contributing factor to the lower than expected P/S. While recent revenue trends over the past medium-term suggest that the risk of a price decline is low, investors appear to see the likelihood of revenue fluctuations in the future.
You need to take note of risks, for example - Renaissance Asia Silk Road Group has 3 warning signs (and 1 which makes us a bit uncomfortable) we think you should know about.
If strong companies turning a profit tickle your fancy, then you'll want to check out this free list of interesting companies that trade on a low P/E (but have proven they can grow earnings).
Valuation is complex, but we're helping make it simple.
Find out whether Renaissance Asia Silk Road Group is potentially over or undervalued by checking out our comprehensive analysis, which includes fair value estimates, risks and warnings, dividends, insider transactions and financial health.
View the Free AnalysisHave feedback on this article? Concerned about the content? Get in touch with us directly. Alternatively, email editorial-team (at) simplywallst.com.
This article by Simply Wall St is general in nature. We provide commentary based on historical data and analyst forecasts only using an unbiased methodology and our articles are not intended to be financial advice. It does not constitute a recommendation to buy or sell any stock, and does not take account of your objectives, or your financial situation. We aim to bring you long-term focused analysis driven by fundamental data. Note that our analysis may not factor in the latest price-sensitive company announcements or qualitative material. Simply Wall St has no position in any stocks mentioned.
About SEHK:274
Renaissance Asia Silk Road Group
Renaissance Asia Silk Road Group Limited, an investment holding company, engages in the exploration, development, and mining of gold in the People's Republic of China.
Mediocre balance sheet and slightly overvalued.
