Stock Analysis
- South Korea
- /
- Semiconductors
- /
- KOSDAQ:A080580
Okins Electronics Co., Ltd.'s (KOSDAQ:080580) Popularity With Investors Under Threat As Stock Sinks 29%
Okins Electronics Co., Ltd. (KOSDAQ:080580) shareholders won't be pleased to see that the share price has had a very rough month, dropping 29% and undoing the prior period's positive performance. For any long-term shareholders, the last month ends a year to forget by locking in a 59% share price decline.
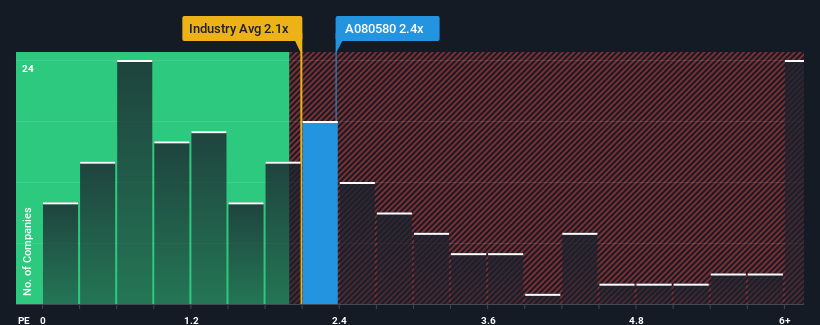
In spite of the heavy fall in price, you could still be forgiven for feeling indifferent about Okins Electronics' P/S ratio of 2.4x, since the median price-to-sales (or "P/S") ratio for the Semiconductor industry in Korea is also close to 2.1x. However, investors might be overlooking a clear opportunity or potential setback if there is no rational basis for the P/S.
Check out our latest analysis for Okins Electronics
What Does Okins Electronics' Recent Performance Look Like?
For example, consider that Okins Electronics' financial performance has been poor lately as its revenue has been in decline. One possibility is that the P/S is moderate because investors think the company might still do enough to be in line with the broader industry in the near future. If you like the company, you'd at least be hoping this is the case so that you could potentially pick up some stock while it's not quite in favour.
Want the full picture on earnings, revenue and cash flow for the company? Then our free report on Okins Electronics will help you shine a light on its historical performance.Do Revenue Forecasts Match The P/S Ratio?
Okins Electronics' P/S ratio would be typical for a company that's only expected to deliver moderate growth, and importantly, perform in line with the industry.
Retrospectively, the last year delivered a frustrating 11% decrease to the company's top line. That put a dampener on the good run it was having over the longer-term as its three-year revenue growth is still a noteworthy 26% in total. Accordingly, while they would have preferred to keep the run going, shareholders would be roughly satisfied with the medium-term rates of revenue growth.
Comparing that to the industry, which is predicted to deliver 81% growth in the next 12 months, the company's momentum is weaker, based on recent medium-term annualised revenue results.
With this information, we find it interesting that Okins Electronics is trading at a fairly similar P/S compared to the industry. Apparently many investors in the company are less bearish than recent times would indicate and aren't willing to let go of their stock right now. They may be setting themselves up for future disappointment if the P/S falls to levels more in line with recent growth rates.
What We Can Learn From Okins Electronics' P/S?
Following Okins Electronics' share price tumble, its P/S is just clinging on to the industry median P/S. It's argued the price-to-sales ratio is an inferior measure of value within certain industries, but it can be a powerful business sentiment indicator.
We've established that Okins Electronics' average P/S is a bit surprising since its recent three-year growth is lower than the wider industry forecast. Right now we are uncomfortable with the P/S as this revenue performance isn't likely to support a more positive sentiment for long. If recent medium-term revenue trends continue, the probability of a share price decline will become quite substantial, placing shareholders at risk.
Don't forget that there may be other risks. For instance, we've identified 5 warning signs for Okins Electronics (2 are concerning) you should be aware of.
If strong companies turning a profit tickle your fancy, then you'll want to check out this free list of interesting companies that trade on a low P/E (but have proven they can grow earnings).
Valuation is complex, but we're helping make it simple.
Find out whether OKins ElectronicsLtd is potentially over or undervalued by checking out our comprehensive analysis, which includes fair value estimates, risks and warnings, dividends, insider transactions and financial health.
View the Free AnalysisHave feedback on this article? Concerned about the content? Get in touch with us directly. Alternatively, email editorial-team (at) simplywallst.com.
This article by Simply Wall St is general in nature. We provide commentary based on historical data and analyst forecasts only using an unbiased methodology and our articles are not intended to be financial advice. It does not constitute a recommendation to buy or sell any stock, and does not take account of your objectives, or your financial situation. We aim to bring you long-term focused analysis driven by fundamental data. Note that our analysis may not factor in the latest price-sensitive company announcements or qualitative material. Simply Wall St has no position in any stocks mentioned.

Simply Wall St
About KOSDAQ:A080580
OKins ElectronicsLtd
Okins Electronics Co., Ltd. manufactures and sells semiconductor inspection sockets.
Imperfect balance sheet with poor track record.
