Stock Analysis
- United States
- /
- Luxury
- /
- NasdaqGS:LULU
Lululemon Athletica Inc.'s (NASDAQ:LULU) 27% Cheaper Price Remains In Tune With Earnings

The Lululemon Athletica Inc. (NASDAQ:LULU) share price has fared very poorly over the last month, falling by a substantial 27%. Longer-term shareholders would now have taken a real hit with the stock declining 9.0% in the last year.
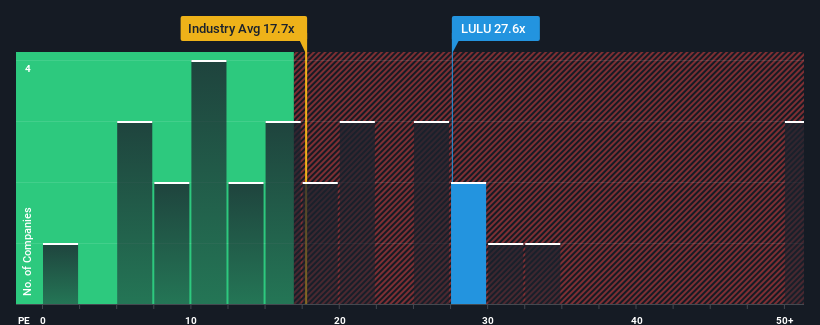
Although its price has dipped substantially, given close to half the companies in the United States have price-to-earnings ratios (or "P/E's") below 16x, you may still consider Lululemon Athletica as a stock to avoid entirely with its 27.6x P/E ratio. However, the P/E might be quite high for a reason and it requires further investigation to determine if it's justified.
With its earnings growth in positive territory compared to the declining earnings of most other companies, Lululemon Athletica has been doing quite well of late. The P/E is probably high because investors think the company will continue to navigate the broader market headwinds better than most. If not, then existing shareholders might be a little nervous about the viability of the share price.
View our latest analysis for Lululemon Athletica
What Are Growth Metrics Telling Us About The High P/E?
The only time you'd be truly comfortable seeing a P/E as steep as Lululemon Athletica's is when the company's growth is on track to outshine the market decidedly.
Taking a look back first, we see that the company grew earnings per share by an impressive 82% last year. The strong recent performance means it was also able to grow EPS by 172% in total over the last three years. Therefore, it's fair to say the earnings growth recently has been superb for the company.
Turning to the outlook, the next three years should generate growth of 13% each year as estimated by the analysts watching the company. With the market only predicted to deliver 10% per annum, the company is positioned for a stronger earnings result.
With this information, we can see why Lululemon Athletica is trading at such a high P/E compared to the market. It seems most investors are expecting this strong future growth and are willing to pay more for the stock.
What We Can Learn From Lululemon Athletica's P/E?
Even after such a strong price drop, Lululemon Athletica's P/E still exceeds the rest of the market significantly. It's argued the price-to-earnings ratio is an inferior measure of value within certain industries, but it can be a powerful business sentiment indicator.
We've established that Lululemon Athletica maintains its high P/E on the strength of its forecast growth being higher than the wider market, as expected. At this stage investors feel the potential for a deterioration in earnings isn't great enough to justify a lower P/E ratio. Unless these conditions change, they will continue to provide strong support to the share price.
The company's balance sheet is another key area for risk analysis. You can assess many of the main risks through our free balance sheet analysis for Lululemon Athletica with six simple checks.
Of course, you might find a fantastic investment by looking at a few good candidates. So take a peek at this free list of companies with a strong growth track record, trading on a low P/E.
Valuation is complex, but we're helping make it simple.
Find out whether Lululemon Athletica is potentially over or undervalued by checking out our comprehensive analysis, which includes fair value estimates, risks and warnings, dividends, insider transactions and financial health.
View the Free AnalysisHave feedback on this article? Concerned about the content? Get in touch with us directly. Alternatively, email editorial-team (at) simplywallst.com.
This article by Simply Wall St is general in nature. We provide commentary based on historical data and analyst forecasts only using an unbiased methodology and our articles are not intended to be financial advice. It does not constitute a recommendation to buy or sell any stock, and does not take account of your objectives, or your financial situation. We aim to bring you long-term focused analysis driven by fundamental data. Note that our analysis may not factor in the latest price-sensitive company announcements or qualitative material. Simply Wall St has no position in any stocks mentioned.

Simply Wall St
About NasdaqGS:LULU
Lululemon Athletica
Lululemon Athletica Inc., together with its subsidiaries, designs, distributes, and retails athletic apparel, footwear, and accessories under the lululemon brand for women and men.
Outstanding track record with flawless balance sheet.
