Stock Analysis
- Australia
- /
- Real Estate
- /
- ASX:LIC
Lifestyle Communities' (ASX:LIC) five-year total shareholder returns outpace the underlying earnings growth

Lifestyle Communities Limited (ASX:LIC) shareholders might be concerned after seeing the share price drop 21% in the last quarter. But that doesn't change the fact that the returns over the last five years have been very strong. It's fair to say most would be happy with 170% the gain in that time. We think it's more important to dwell on the long term returns than the short term returns. Ultimately business performance will determine whether the stock price continues the positive long term trend.
Since the long term performance has been good but there's been a recent pullback of 6.2%, let's check if the fundamentals match the share price.
See our latest analysis for Lifestyle Communities
In his essay The Superinvestors of Graham-and-Doddsville Warren Buffett described how share prices do not always rationally reflect the value of a business. One way to examine how market sentiment has changed over time is to look at the interaction between a company's share price and its earnings per share (EPS).
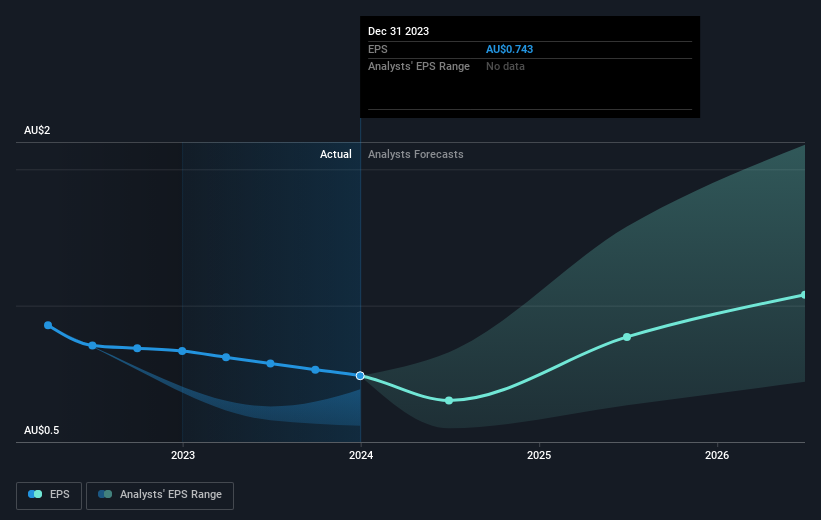
During five years of share price growth, Lifestyle Communities achieved compound earnings per share (EPS) growth of 2.6% per year. This EPS growth is slower than the share price growth of 22% per year, over the same period. So it's fair to assume the market has a higher opinion of the business than it did five years ago. That's not necessarily surprising considering the five-year track record of earnings growth.
The company's earnings per share (over time) is depicted in the image below (click to see the exact numbers).
It's probably worth noting we've seen significant insider buying in the last quarter, which we consider a positive. On the other hand, we think the revenue and earnings trends are much more meaningful measures of the business. It might be well worthwhile taking a look at our free report on Lifestyle Communities' earnings, revenue and cash flow.
What About Dividends?
As well as measuring the share price return, investors should also consider the total shareholder return (TSR). The TSR incorporates the value of any spin-offs or discounted capital raisings, along with any dividends, based on the assumption that the dividends are reinvested. So for companies that pay a generous dividend, the TSR is often a lot higher than the share price return. As it happens, Lifestyle Communities' TSR for the last 5 years was 182%, which exceeds the share price return mentioned earlier. And there's no prize for guessing that the dividend payments largely explain the divergence!
A Different Perspective
While the broader market gained around 11% in the last year, Lifestyle Communities shareholders lost 17% (even including dividends). Even the share prices of good stocks drop sometimes, but we want to see improvements in the fundamental metrics of a business, before getting too interested. Longer term investors wouldn't be so upset, since they would have made 23%, each year, over five years. If the fundamental data continues to indicate long term sustainable growth, the current sell-off could be an opportunity worth considering. It's always interesting to track share price performance over the longer term. But to understand Lifestyle Communities better, we need to consider many other factors. To that end, you should learn about the 3 warning signs we've spotted with Lifestyle Communities (including 2 which don't sit too well with us) .
Lifestyle Communities is not the only stock that insiders are buying. For those who like to find winning investments this free list of growing companies with recent insider purchasing, could be just the ticket.
Please note, the market returns quoted in this article reflect the market weighted average returns of stocks that currently trade on Australian exchanges.
Valuation is complex, but we're helping make it simple.
Find out whether Lifestyle Communities is potentially over or undervalued by checking out our comprehensive analysis, which includes fair value estimates, risks and warnings, dividends, insider transactions and financial health.
View the Free AnalysisHave feedback on this article? Concerned about the content? Get in touch with us directly. Alternatively, email editorial-team (at) simplywallst.com.
This article by Simply Wall St is general in nature. We provide commentary based on historical data and analyst forecasts only using an unbiased methodology and our articles are not intended to be financial advice. It does not constitute a recommendation to buy or sell any stock, and does not take account of your objectives, or your financial situation. We aim to bring you long-term focused analysis driven by fundamental data. Note that our analysis may not factor in the latest price-sensitive company announcements or qualitative material. Simply Wall St has no position in any stocks mentioned.

Simply Wall St
About ASX:LIC
Lifestyle Communities
Lifestyle Communities Limited, together with its subsidiaries, provides housing for its homeowners in community in Australia.
High growth potential and fair value.
