Stock Analysis
Laboratorios Farmaceuticos Rovi (BME:ROVI) shareholders have earned a 35% CAGR over the last five years

We think all investors should try to buy and hold high quality multi-year winners. And we've seen some truly amazing gains over the years. Just think about the savvy investors who held Laboratorios Farmaceuticos Rovi, S.A. (BME:ROVI) shares for the last five years, while they gained 322%. This just goes to show the value creation that some businesses can achieve. Also pleasing for shareholders was the 34% gain in the last three months.
So let's investigate and see if the longer term performance of the company has been in line with the underlying business' progress.
View our latest analysis for Laboratorios Farmaceuticos Rovi
To paraphrase Benjamin Graham: Over the short term the market is a voting machine, but over the long term it's a weighing machine. One imperfect but simple way to consider how the market perception of a company has shifted is to compare the change in the earnings per share (EPS) with the share price movement.
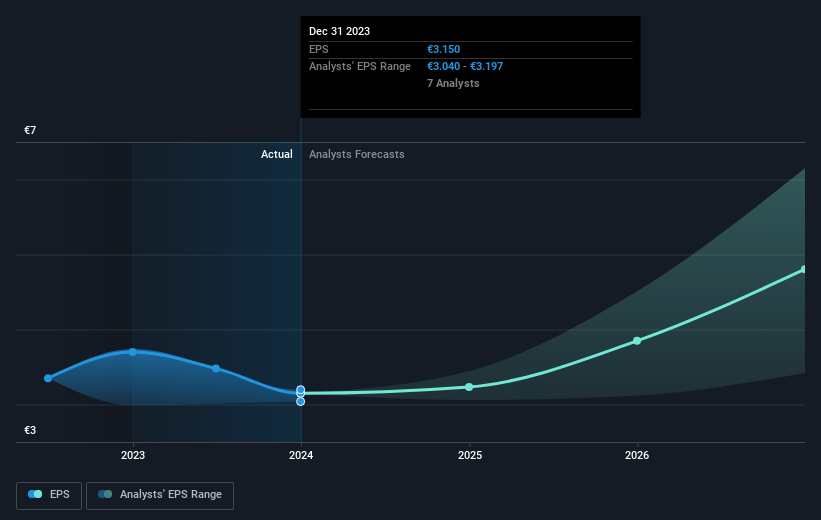
During five years of share price growth, Laboratorios Farmaceuticos Rovi achieved compound earnings per share (EPS) growth of 57% per year. The EPS growth is more impressive than the yearly share price gain of 33% over the same period. So one could conclude that the broader market has become more cautious towards the stock.
You can see below how EPS has changed over time (discover the exact values by clicking on the image).
It is of course excellent to see how Laboratorios Farmaceuticos Rovi has grown profits over the years, but the future is more important for shareholders. If you are thinking of buying or selling Laboratorios Farmaceuticos Rovi stock, you should check out this FREE detailed report on its balance sheet.
What About Dividends?
When looking at investment returns, it is important to consider the difference between total shareholder return (TSR) and share price return. Whereas the share price return only reflects the change in the share price, the TSR includes the value of dividends (assuming they were reinvested) and the benefit of any discounted capital raising or spin-off. It's fair to say that the TSR gives a more complete picture for stocks that pay a dividend. We note that for Laboratorios Farmaceuticos Rovi the TSR over the last 5 years was 343%, which is better than the share price return mentioned above. The dividends paid by the company have thusly boosted the total shareholder return.
A Different Perspective
We're pleased to report that Laboratorios Farmaceuticos Rovi shareholders have received a total shareholder return of 109% over one year. And that does include the dividend. That gain is better than the annual TSR over five years, which is 35%. Therefore it seems like sentiment around the company has been positive lately. In the best case scenario, this may hint at some real business momentum, implying that now could be a great time to delve deeper. It's always interesting to track share price performance over the longer term. But to understand Laboratorios Farmaceuticos Rovi better, we need to consider many other factors. Consider risks, for instance. Every company has them, and we've spotted 1 warning sign for Laboratorios Farmaceuticos Rovi you should know about.
But note: Laboratorios Farmaceuticos Rovi may not be the best stock to buy. So take a peek at this free list of interesting companies with past earnings growth (and further growth forecast).
Please note, the market returns quoted in this article reflect the market weighted average returns of stocks that currently trade on Spanish exchanges.
Valuation is complex, but we're helping make it simple.
Find out whether Laboratorios Farmaceuticos Rovi is potentially over or undervalued by checking out our comprehensive analysis, which includes fair value estimates, risks and warnings, dividends, insider transactions and financial health.
View the Free AnalysisHave feedback on this article? Concerned about the content? Get in touch with us directly. Alternatively, email editorial-team (at) simplywallst.com.
This article by Simply Wall St is general in nature. We provide commentary based on historical data and analyst forecasts only using an unbiased methodology and our articles are not intended to be financial advice. It does not constitute a recommendation to buy or sell any stock, and does not take account of your objectives, or your financial situation. We aim to bring you long-term focused analysis driven by fundamental data. Note that our analysis may not factor in the latest price-sensitive company announcements or qualitative material. Simply Wall St has no position in any stocks mentioned.
About BME:ROVI
Laboratorios Farmaceuticos Rovi
Laboratorios Farmaceuticos Rovi, S.A. engages in the research, development, manufacture, and marketing of pharmaceutical products in Spain and internationally.
Excellent balance sheet and good value.
