Stock Analysis
- Taiwan
- /
- Electronic Equipment and Components
- /
- TWSE:3167
Is Ta Liang Technology (TWSE:3167) A Risky Investment?

Legendary fund manager Li Lu (who Charlie Munger backed) once said, 'The biggest investment risk is not the volatility of prices, but whether you will suffer a permanent loss of capital.' So it might be obvious that you need to consider debt, when you think about how risky any given stock is, because too much debt can sink a company. Importantly, Ta Liang Technology Co., Ltd. (TWSE:3167) does carry debt. But is this debt a concern to shareholders?
When Is Debt Dangerous?
Debt assists a business until the business has trouble paying it off, either with new capital or with free cash flow. In the worst case scenario, a company can go bankrupt if it cannot pay its creditors. However, a more common (but still painful) scenario is that it has to raise new equity capital at a low price, thus permanently diluting shareholders. By replacing dilution, though, debt can be an extremely good tool for businesses that need capital to invest in growth at high rates of return. When we examine debt levels, we first consider both cash and debt levels, together.
Check out our latest analysis for Ta Liang Technology
How Much Debt Does Ta Liang Technology Carry?
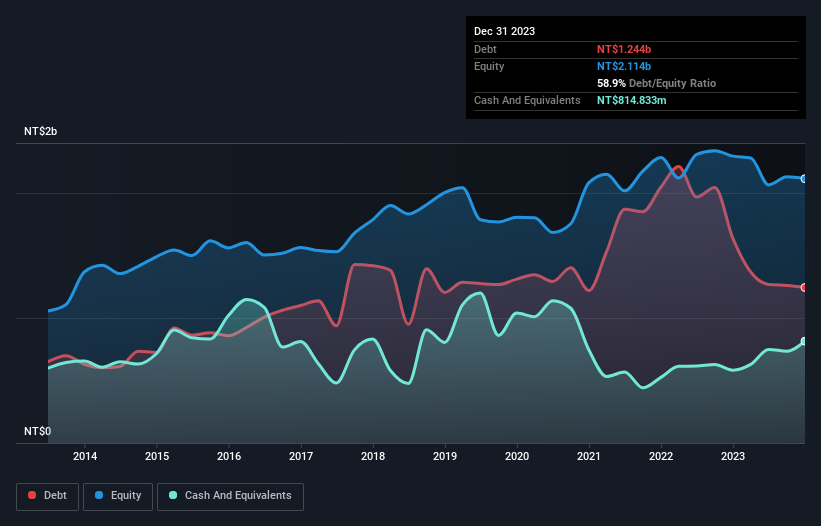
The image below, which you can click on for greater detail, shows that Ta Liang Technology had debt of NT$1.24b at the end of December 2023, a reduction from NT$1.64b over a year. However, because it has a cash reserve of NT$814.8m, its net debt is less, at about NT$429.5m.
How Strong Is Ta Liang Technology's Balance Sheet?
We can see from the most recent balance sheet that Ta Liang Technology had liabilities of NT$1.41b falling due within a year, and liabilities of NT$801.5m due beyond that. On the other hand, it had cash of NT$814.8m and NT$837.1m worth of receivables due within a year. So its liabilities outweigh the sum of its cash and (near-term) receivables by NT$559.4m.
Given Ta Liang Technology has a market capitalization of NT$5.12b, it's hard to believe these liabilities pose much threat. However, we do think it is worth keeping an eye on its balance sheet strength, as it may change over time. When analysing debt levels, the balance sheet is the obvious place to start. But you can't view debt in total isolation; since Ta Liang Technology will need earnings to service that debt. So when considering debt, it's definitely worth looking at the earnings trend. Click here for an interactive snapshot.
In the last year Ta Liang Technology had a loss before interest and tax, and actually shrunk its revenue by 45%, to NT$1.3b. That makes us nervous, to say the least.
Caveat Emptor
Not only did Ta Liang Technology's revenue slip over the last twelve months, but it also produced negative earnings before interest and tax (EBIT). To be specific the EBIT loss came in at NT$48m. Considering that alongside the liabilities mentioned above does not give us much confidence that company should be using so much debt. Quite frankly we think the balance sheet is far from match-fit, although it could be improved with time. On the bright side, we note that trailing twelve month EBIT is worse than the free cash flow of NT$850m and the profit of NT$13m. So if we focus on those metrics there seems to be a chance the company will manage its debt without much trouble. The balance sheet is clearly the area to focus on when you are analysing debt. But ultimately, every company can contain risks that exist outside of the balance sheet. We've identified 5 warning signs with Ta Liang Technology (at least 1 which can't be ignored) , and understanding them should be part of your investment process.
Of course, if you're the type of investor who prefers buying stocks without the burden of debt, then don't hesitate to discover our exclusive list of net cash growth stocks, today.
Valuation is complex, but we're helping make it simple.
Find out whether Ta Liang Technology is potentially over or undervalued by checking out our comprehensive analysis, which includes fair value estimates, risks and warnings, dividends, insider transactions and financial health.
View the Free AnalysisHave feedback on this article? Concerned about the content? Get in touch with us directly. Alternatively, email editorial-team (at) simplywallst.com.
This article by Simply Wall St is general in nature. We provide commentary based on historical data and analyst forecasts only using an unbiased methodology and our articles are not intended to be financial advice. It does not constitute a recommendation to buy or sell any stock, and does not take account of your objectives, or your financial situation. We aim to bring you long-term focused analysis driven by fundamental data. Note that our analysis may not factor in the latest price-sensitive company announcements or qualitative material. Simply Wall St has no position in any stocks mentioned.
About TWSE:3167
Ta Liang Technology
Ta Liang Technology Co., Ltd. engages in the manufacturing of semiconductor inspection, PCB routing and drilling machines, resin panel cutters, CNC engraving and milling machines, and glass panel processing machines in Taiwan.
Excellent balance sheet unattractive dividend payer.
