Stock Analysis
- Romania
- /
- Real Estate
- /
- BVB:CMCM
Is S.C. Comcm S.A.'s (BVB:CMCM) Recent Stock Performance Tethered To Its Strong Fundamentals?

S.C. Comcm (BVB:CMCM) has had a great run on the share market with its stock up by a significant 60% over the last month. Since the market usually pay for a company’s long-term fundamentals, we decided to study the company’s key performance indicators to see if they could be influencing the market. Particularly, we will be paying attention to S.C. Comcm's ROE today.
ROE or return on equity is a useful tool to assess how effectively a company can generate returns on the investment it received from its shareholders. Simply put, it is used to assess the profitability of a company in relation to its equity capital.
Check out our latest analysis for S.C. Comcm
How Do You Calculate Return On Equity?
The formula for return on equity is:
Return on Equity = Net Profit (from continuing operations) ÷ Shareholders' Equity
So, based on the above formula, the ROE for S.C. Comcm is:
47% = RON26m ÷ RON55m (Based on the trailing twelve months to September 2023).
The 'return' is the yearly profit. One way to conceptualize this is that for each RON1 of shareholders' capital it has, the company made RON0.47 in profit.
What Is The Relationship Between ROE And Earnings Growth?
Thus far, we have learned that ROE measures how efficiently a company is generating its profits. Based on how much of its profits the company chooses to reinvest or "retain", we are then able to evaluate a company's future ability to generate profits. Generally speaking, other things being equal, firms with a high return on equity and profit retention, have a higher growth rate than firms that don’t share these attributes.
S.C. Comcm's Earnings Growth And 47% ROE
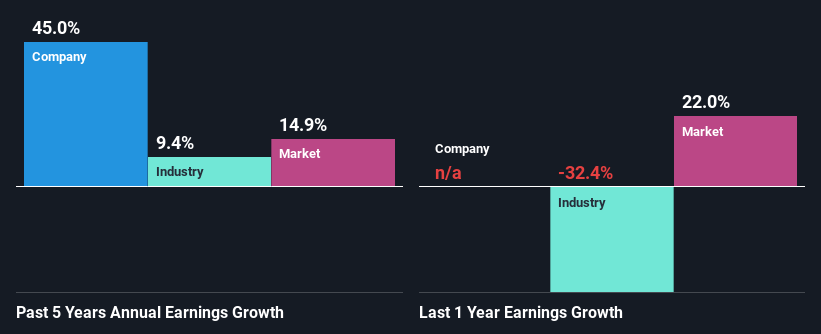
Firstly, we acknowledge that S.C. Comcm has a significantly high ROE. Additionally, the company's ROE is higher compared to the industry average of 5.6% which is quite remarkable. So, the substantial 45% net income growth seen by S.C. Comcm over the past five years isn't overly surprising.
We then compared S.C. Comcm's net income growth with the industry and we're pleased to see that the company's growth figure is higher when compared with the industry which has a growth rate of 9.4% in the same 5-year period.
The basis for attaching value to a company is, to a great extent, tied to its earnings growth. It’s important for an investor to know whether the market has priced in the company's expected earnings growth (or decline). Doing so will help them establish if the stock's future looks promising or ominous. Is S.C. Comcm fairly valued compared to other companies? These 3 valuation measures might help you decide.
Is S.C. Comcm Efficiently Re-investing Its Profits?
Given that S.C. Comcm doesn't pay any dividend to its shareholders, we infer that the company has been reinvesting all of its profits to grow its business.
Summary
Overall, we are quite pleased with S.C. Comcm's performance. Particularly, we like that the company is reinvesting heavily into its business, and at a high rate of return. Unsurprisingly, this has led to an impressive earnings growth. If the company continues to grow its earnings the way it has, that could have a positive impact on its share price given how earnings per share influence long-term share prices. Not to forget, share price outcomes are also dependent on the potential risks a company may face. So it is important for investors to be aware of the risks involved in the business. You can see the 3 risks we have identified for S.C. Comcm by visiting our risks dashboard for free on our platform here.
Valuation is complex, but we're helping make it simple.
Find out whether S.C. Comcm is potentially over or undervalued by checking out our comprehensive analysis, which includes fair value estimates, risks and warnings, dividends, insider transactions and financial health.
View the Free AnalysisHave feedback on this article? Concerned about the content? Get in touch with us directly. Alternatively, email editorial-team (at) simplywallst.com.
This article by Simply Wall St is general in nature. We provide commentary based on historical data and analyst forecasts only using an unbiased methodology and our articles are not intended to be financial advice. It does not constitute a recommendation to buy or sell any stock, and does not take account of your objectives, or your financial situation. We aim to bring you long-term focused analysis driven by fundamental data. Note that our analysis may not factor in the latest price-sensitive company announcements or qualitative material. Simply Wall St has no position in any stocks mentioned.
About BVB:CMCM
S.C. Comcm
S.C. Comcm S.A. engages in the manufacture and sale of concrete in Romania.
Flawless balance sheet with proven track record.
