Stock Analysis
- South Korea
- /
- Telecom Services and Carriers
- /
- KOSE:A030200
Is KT (KRX:030200) Using Too Much Debt?
David Iben put it well when he said, 'Volatility is not a risk we care about. What we care about is avoiding the permanent loss of capital.' When we think about how risky a company is, we always like to look at its use of debt, since debt overload can lead to ruin. We note that KT Corporation (KRX:030200) does have debt on its balance sheet. But should shareholders be worried about its use of debt?
Why Does Debt Bring Risk?
Generally speaking, debt only becomes a real problem when a company can't easily pay it off, either by raising capital or with its own cash flow. If things get really bad, the lenders can take control of the business. While that is not too common, we often do see indebted companies permanently diluting shareholders because lenders force them to raise capital at a distressed price. Having said that, the most common situation is where a company manages its debt reasonably well - and to its own advantage. When we think about a company's use of debt, we first look at cash and debt together.
Check out our latest analysis for KT
How Much Debt Does KT Carry?
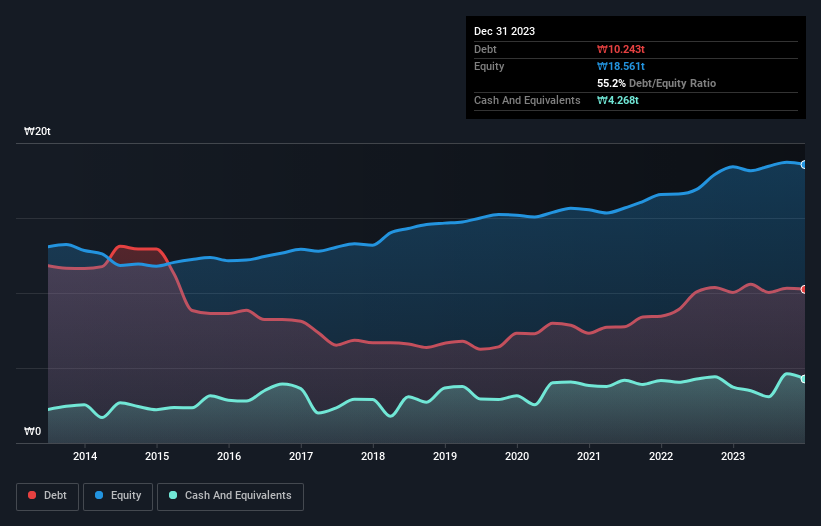
As you can see below, KT had ₩10t of debt, at December 2023, which is about the same as the year before. You can click the chart for greater detail. However, it does have ₩4.27t in cash offsetting this, leading to net debt of about ₩5.97t.
How Healthy Is KT's Balance Sheet?
Zooming in on the latest balance sheet data, we can see that KT had liabilities of ₩13t due within 12 months and liabilities of ₩11t due beyond that. Offsetting these obligations, it had cash of ₩4.27t as well as receivables valued at ₩7.17t due within 12 months. So its liabilities total ₩13t more than the combination of its cash and short-term receivables.
This deficit casts a shadow over the ₩8.46t company, like a colossus towering over mere mortals. So we'd watch its balance sheet closely, without a doubt. After all, KT would likely require a major re-capitalisation if it had to pay its creditors today.
In order to size up a company's debt relative to its earnings, we calculate its net debt divided by its earnings before interest, tax, depreciation, and amortization (EBITDA) and its earnings before interest and tax (EBIT) divided by its interest expense (its interest cover). This way, we consider both the absolute quantum of the debt, as well as the interest rates paid on it.
KT has a low net debt to EBITDA ratio of only 1.2. And its EBIT easily covers its interest expense, being 21.5 times the size. So we're pretty relaxed about its super-conservative use of debt. On the other hand, KT saw its EBIT drop by 2.4% in the last twelve months. If earnings continue to decline at that rate the company may have increasing difficulty managing its debt load. The balance sheet is clearly the area to focus on when you are analysing debt. But ultimately the future profitability of the business will decide if KT can strengthen its balance sheet over time. So if you want to see what the professionals think, you might find this free report on analyst profit forecasts to be interesting.
Finally, while the tax-man may adore accounting profits, lenders only accept cold hard cash. So we always check how much of that EBIT is translated into free cash flow. Looking at the most recent three years, KT recorded free cash flow of 47% of its EBIT, which is weaker than we'd expect. That weak cash conversion makes it more difficult to handle indebtedness.
Our View
We'd go so far as to say KT's level of total liabilities was disappointing. But on the bright side, its interest cover is a good sign, and makes us more optimistic. Once we consider all the factors above, together, it seems to us that KT's debt is making it a bit risky. That's not necessarily a bad thing, but we'd generally feel more comfortable with less leverage. When analysing debt levels, the balance sheet is the obvious place to start. However, not all investment risk resides within the balance sheet - far from it. Be aware that KT is showing 1 warning sign in our investment analysis , you should know about...
If you're interested in investing in businesses that can grow profits without the burden of debt, then check out this free list of growing businesses that have net cash on the balance sheet.
Valuation is complex, but we're helping make it simple.
Find out whether KT is potentially over or undervalued by checking out our comprehensive analysis, which includes fair value estimates, risks and warnings, dividends, insider transactions and financial health.
View the Free AnalysisHave feedback on this article? Concerned about the content? Get in touch with us directly. Alternatively, email editorial-team (at) simplywallst.com.
This article by Simply Wall St is general in nature. We provide commentary based on historical data and analyst forecasts only using an unbiased methodology and our articles are not intended to be financial advice. It does not constitute a recommendation to buy or sell any stock, and does not take account of your objectives, or your financial situation. We aim to bring you long-term focused analysis driven by fundamental data. Note that our analysis may not factor in the latest price-sensitive company announcements or qualitative material. Simply Wall St has no position in any stocks mentioned.

Simply Wall St
About KOSE:A030200
KT
KT Corporation provides integrated telecommunications and platform services in Korea and internationally.
Undervalued with excellent balance sheet and pays a dividend.
