Stock Analysis
- Sweden
- /
- Professional Services
- /
- OM:HIFA B
Is Hifab Group AB (publ)'s (STO:HIFA B) Recent Stock Performance Tethered To Its Strong Fundamentals?

Hifab Group's (STO:HIFA B) stock is up by a considerable 10% over the past week. Since the market usually pay for a company’s long-term fundamentals, we decided to study the company’s key performance indicators to see if they could be influencing the market. Specifically, we decided to study Hifab Group's ROE in this article.
ROE or return on equity is a useful tool to assess how effectively a company can generate returns on the investment it received from its shareholders. In short, ROE shows the profit each dollar generates with respect to its shareholder investments.
Check out our latest analysis for Hifab Group
How Do You Calculate Return On Equity?
ROE can be calculated by using the formula:
Return on Equity = Net Profit (from continuing operations) ÷ Shareholders' Equity
So, based on the above formula, the ROE for Hifab Group is:
21% = kr13m ÷ kr60m (Based on the trailing twelve months to December 2023).
The 'return' is the amount earned after tax over the last twelve months. One way to conceptualize this is that for each SEK1 of shareholders' capital it has, the company made SEK0.21 in profit.
Why Is ROE Important For Earnings Growth?
We have already established that ROE serves as an efficient profit-generating gauge for a company's future earnings. Depending on how much of these profits the company reinvests or "retains", and how effectively it does so, we are then able to assess a company’s earnings growth potential. Assuming everything else remains unchanged, the higher the ROE and profit retention, the higher the growth rate of a company compared to companies that don't necessarily bear these characteristics.
A Side By Side comparison of Hifab Group's Earnings Growth And 21% ROE
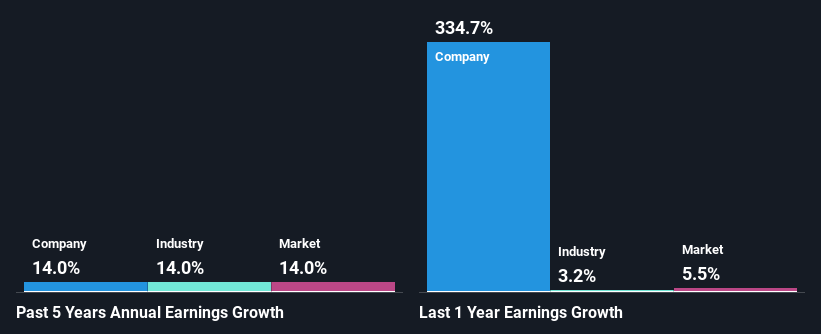
To begin with, Hifab Group has a pretty high ROE which is interesting. However, a comparison to the industry average of 27% stops us from getting too excited. Although, we can see that Hifab Group saw a modest net income growth of 14% over the past five years. So, there might be other aspects that are positively influencing the company's earnings growth. For instance, the company has a low payout ratio or is being managed efficiently. However, not to forget, the company does have a high ROE to begin with, just that it is lower than the industry average. So the high ROE levels also provide some context to the earnings growth seen by the company.
We then performed a comparison between Hifab Group's net income growth with the industry, which revealed that the company's growth is similar to the average industry growth of 14% in the same 5-year period.
Earnings growth is an important metric to consider when valuing a stock. It’s important for an investor to know whether the market has priced in the company's expected earnings growth (or decline). This then helps them determine if the stock is placed for a bright or bleak future. One good indicator of expected earnings growth is the P/E ratio which determines the price the market is willing to pay for a stock based on its earnings prospects. So, you may want to check if Hifab Group is trading on a high P/E or a low P/E, relative to its industry.
Is Hifab Group Making Efficient Use Of Its Profits?
Hifab Group doesn't pay any regular dividends, meaning that all of its profits are being reinvested in the business, which explains the fair bit of earnings growth the company has seen.
Summary
Overall, we are quite pleased with Hifab Group's performance. Particularly, we like that the company is reinvesting heavily into its business at a moderate rate of return. Unsurprisingly, this has led to an impressive earnings growth. If the company continues to grow its earnings the way it has, that could have a positive impact on its share price given how earnings per share influence long-term share prices. Not to forget, share price outcomes are also dependent on the potential risks a company may face. So it is important for investors to be aware of the risks involved in the business. Our risks dashboard would have the 2 risks we have identified for Hifab Group.
Valuation is complex, but we're helping make it simple.
Find out whether Hifab Group is potentially over or undervalued by checking out our comprehensive analysis, which includes fair value estimates, risks and warnings, dividends, insider transactions and financial health.
View the Free AnalysisHave feedback on this article? Concerned about the content? Get in touch with us directly. Alternatively, email editorial-team (at) simplywallst.com.
This article by Simply Wall St is general in nature. We provide commentary based on historical data and analyst forecasts only using an unbiased methodology and our articles are not intended to be financial advice. It does not constitute a recommendation to buy or sell any stock, and does not take account of your objectives, or your financial situation. We aim to bring you long-term focused analysis driven by fundamental data. Note that our analysis may not factor in the latest price-sensitive company announcements or qualitative material. Simply Wall St has no position in any stocks mentioned.

Simply Wall St
About OM:HIFA B
Hifab Group
Hifab Group AB (publ) provides project management and consulting services in Sweden, rest of Europe, Asia, and Africa.
Outstanding track record with excellent balance sheet.
