
Key Insights
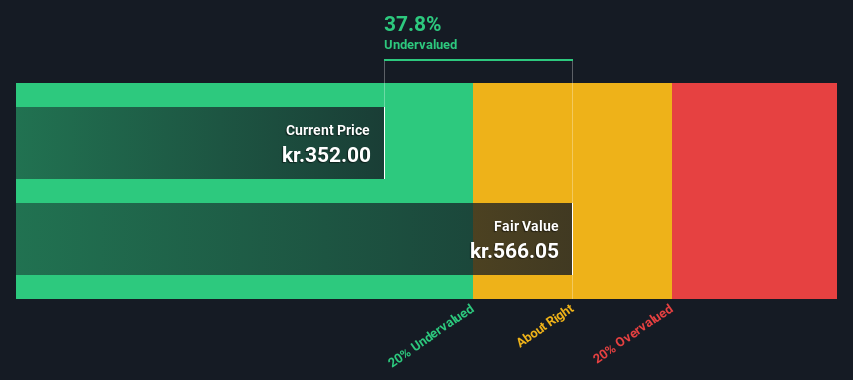
- FLSmidth's estimated fair value is kr.566 based on 2 Stage Free Cash Flow to Equity
- FLSmidth is estimated to be 38% undervalued based on current share price of kr.352
- The kr.346 analyst price target for FLS is 39% less than our estimate of fair value
Today we'll do a simple run through of a valuation method used to estimate the attractiveness of FLSmidth & Co. A/S (CPH:FLS) as an investment opportunity by projecting its future cash flows and then discounting them to today's value. This will be done using the Discounted Cash Flow (DCF) model. Believe it or not, it's not too difficult to follow, as you'll see from our example!
Remember though, that there are many ways to estimate a company's value, and a DCF is just one method. If you still have some burning questions about this type of valuation, take a look at the Simply Wall St analysis model.
See our latest analysis for FLSmidth
What's The Estimated Valuation?
We use what is known as a 2-stage model, which simply means we have two different periods of growth rates for the company's cash flows. Generally the first stage is higher growth, and the second stage is a lower growth phase. In the first stage we need to estimate the cash flows to the business over the next ten years. Where possible we use analyst estimates, but when these aren't available we extrapolate the previous free cash flow (FCF) from the last estimate or reported value. We assume companies with shrinking free cash flow will slow their rate of shrinkage, and that companies with growing free cash flow will see their growth rate slow, over this period. We do this to reflect that growth tends to slow more in the early years than it does in later years.
A DCF is all about the idea that a dollar in the future is less valuable than a dollar today, and so the sum of these future cash flows is then discounted to today's value:
10-year free cash flow (FCF) forecast
| 2024 | 2025 | 2026 | 2027 | 2028 | 2029 | 2030 | 2031 | 2032 | 2033 | |
| Levered FCF (DKK, Millions) | kr.235.3m | kr.946.6m | kr.1.35b | kr.1.55b | kr.1.64b | kr.1.71b | kr.1.76b | kr.1.80b | kr.1.83b | kr.1.86b |
| Growth Rate Estimate Source | Analyst x3 | Analyst x5 | Analyst x4 | Analyst x1 | Analyst x1 | Est @ 3.94% | Est @ 2.99% | Est @ 2.33% | Est @ 1.86% | Est @ 1.54% |
| Present Value (DKK, Millions) Discounted @ 5.7% | kr.223 | kr.847 | kr.1.1k | kr.1.2k | kr.1.2k | kr.1.2k | kr.1.2k | kr.1.2k | kr.1.1k | kr.1.1k |
("Est" = FCF growth rate estimated by Simply Wall St)
Present Value of 10-year Cash Flow (PVCF) = kr.10b
After calculating the present value of future cash flows in the initial 10-year period, we need to calculate the Terminal Value, which accounts for all future cash flows beyond the first stage. The Gordon Growth formula is used to calculate Terminal Value at a future annual growth rate equal to the 5-year average of the 10-year government bond yield of 0.8%. We discount the terminal cash flows to today's value at a cost of equity of 5.7%.
Terminal Value (TV)= FCF2033 × (1 + g) ÷ (r – g) = kr.1.9b× (1 + 0.8%) ÷ (5.7%– 0.8%) = kr.38b
Present Value of Terminal Value (PVTV)= TV / (1 + r)10= kr.38b÷ ( 1 + 5.7%)10= kr.22b
The total value, or equity value, is then the sum of the present value of the future cash flows, which in this case is kr.32b. To get the intrinsic value per share, we divide this by the total number of shares outstanding. Compared to the current share price of kr.352, the company appears quite good value at a 38% discount to where the stock price trades currently. The assumptions in any calculation have a big impact on the valuation, so it is better to view this as a rough estimate, not precise down to the last cent.
The Assumptions
The calculation above is very dependent on two assumptions. The first is the discount rate and the other is the cash flows. If you don't agree with these result, have a go at the calculation yourself and play with the assumptions. The DCF also does not consider the possible cyclicality of an industry, or a company's future capital requirements, so it does not give a full picture of a company's potential performance. Given that we are looking at FLSmidth as potential shareholders, the cost of equity is used as the discount rate, rather than the cost of capital (or weighted average cost of capital, WACC) which accounts for debt. In this calculation we've used 5.7%, which is based on a levered beta of 1.076. Beta is a measure of a stock's volatility, compared to the market as a whole. We get our beta from the industry average beta of globally comparable companies, with an imposed limit between 0.8 and 2.0, which is a reasonable range for a stable business.
SWOT Analysis for FLSmidth
- Earnings growth over the past year exceeded the industry.
- Debt is not viewed as a risk.
- Dividend is low compared to the top 25% of dividend payers in the Machinery market.
- Annual earnings are forecast to grow faster than the Danish market.
- Trading below our estimate of fair value by more than 20%.
- Dividends are not covered by cash flow.
- Annual revenue is expected to decline over the next 3 years.
Next Steps:
Whilst important, the DCF calculation is only one of many factors that you need to assess for a company. It's not possible to obtain a foolproof valuation with a DCF model. Instead the best use for a DCF model is to test certain assumptions and theories to see if they would lead to the company being undervalued or overvalued. If a company grows at a different rate, or if its cost of equity or risk free rate changes sharply, the output can look very different. What is the reason for the share price sitting below the intrinsic value? For FLSmidth, we've put together three essential elements you should consider:
- Risks: Be aware that FLSmidth is showing 1 warning sign in our investment analysis , you should know about...
- Future Earnings: How does FLS's growth rate compare to its peers and the wider market? Dig deeper into the analyst consensus number for the upcoming years by interacting with our free analyst growth expectation chart.
- Other High Quality Alternatives: Do you like a good all-rounder? Explore our interactive list of high quality stocks to get an idea of what else is out there you may be missing!
PS. Simply Wall St updates its DCF calculation for every Danish stock every day, so if you want to find the intrinsic value of any other stock just search here.
Valuation is complex, but we're helping make it simple.
Find out whether FLSmidth is potentially over or undervalued by checking out our comprehensive analysis, which includes fair value estimates, risks and warnings, dividends, insider transactions and financial health.
View the Free AnalysisHave feedback on this article? Concerned about the content? Get in touch with us directly. Alternatively, email editorial-team (at) simplywallst.com.
This article by Simply Wall St is general in nature. We provide commentary based on historical data and analyst forecasts only using an unbiased methodology and our articles are not intended to be financial advice. It does not constitute a recommendation to buy or sell any stock, and does not take account of your objectives, or your financial situation. We aim to bring you long-term focused analysis driven by fundamental data. Note that our analysis may not factor in the latest price-sensitive company announcements or qualitative material. Simply Wall St has no position in any stocks mentioned.

Simply Wall St
About CPSE:FLS
FLSmidth
FLSmidth & Co. A/S provides flowsheet technology and service solutions for the mining and cement industries in North America, South America, Europe, North and Sub-Saharan Africa, the Middle East, Central and South Asia, the Asia Pacific, and Australia.
Flawless balance sheet with moderate growth potential.
