Stock Analysis
- United Kingdom
- /
- Capital Markets
- /
- LSE:ASHM
Investors five-year losses continue as Ashmore Group (LON:ASHM) dips a further 4.6% this week, earnings continue to decline

The main aim of stock picking is to find the market-beating stocks. But the main game is to find enough winners to more than offset the losers So we wouldn't blame long term Ashmore Group Plc (LON:ASHM) shareholders for doubting their decision to hold, with the stock down 62% over a half decade. Shareholders have had an even rougher run lately, with the share price down 19% in the last 90 days.
If the past week is anything to go by, investor sentiment for Ashmore Group isn't positive, so let's see if there's a mismatch between fundamentals and the share price.
Check out our latest analysis for Ashmore Group
While the efficient markets hypothesis continues to be taught by some, it has been proven that markets are over-reactive dynamic systems, and investors are not always rational. One flawed but reasonable way to assess how sentiment around a company has changed is to compare the earnings per share (EPS) with the share price.
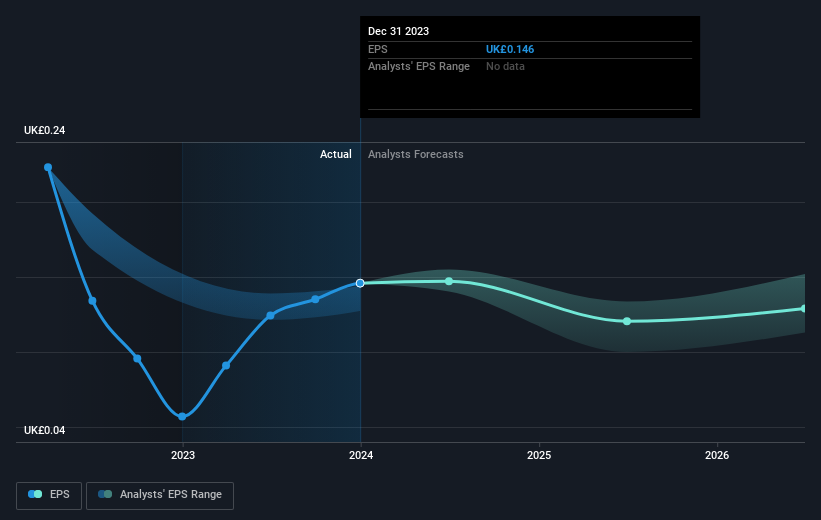
Looking back five years, both Ashmore Group's share price and EPS declined; the latter at a rate of 7.0% per year. Readers should note that the share price has fallen faster than the EPS, at a rate of 18% per year, over the period. So it seems the market was too confident about the business, in the past.
You can see how EPS has changed over time in the image below (click on the chart to see the exact values).
We're pleased to report that the CEO is remunerated more modestly than most CEOs at similarly capitalized companies. It's always worth keeping an eye on CEO pay, but a more important question is whether the company will grow earnings throughout the years. Before buying or selling a stock, we always recommend a close examination of historic growth trends, available here..
What About Dividends?
As well as measuring the share price return, investors should also consider the total shareholder return (TSR). The TSR is a return calculation that accounts for the value of cash dividends (assuming that any dividend received was reinvested) and the calculated value of any discounted capital raisings and spin-offs. It's fair to say that the TSR gives a more complete picture for stocks that pay a dividend. As it happens, Ashmore Group's TSR for the last 5 years was -48%, which exceeds the share price return mentioned earlier. This is largely a result of its dividend payments!
A Different Perspective
While the broader market gained around 3.6% in the last year, Ashmore Group shareholders lost 19% (even including dividends). However, keep in mind that even the best stocks will sometimes underperform the market over a twelve month period. Regrettably, last year's performance caps off a bad run, with the shareholders facing a total loss of 8% per year over five years. We realise that Baron Rothschild has said investors should "buy when there is blood on the streets", but we caution that investors should first be sure they are buying a high quality business. It's always interesting to track share price performance over the longer term. But to understand Ashmore Group better, we need to consider many other factors. For instance, we've identified 2 warning signs for Ashmore Group that you should be aware of.
Of course, you might find a fantastic investment by looking elsewhere. So take a peek at this free list of companies we expect will grow earnings.
Please note, the market returns quoted in this article reflect the market weighted average returns of stocks that currently trade on British exchanges.
Valuation is complex, but we're helping make it simple.
Find out whether Ashmore Group is potentially over or undervalued by checking out our comprehensive analysis, which includes fair value estimates, risks and warnings, dividends, insider transactions and financial health.
View the Free AnalysisHave feedback on this article? Concerned about the content? Get in touch with us directly. Alternatively, email editorial-team (at) simplywallst.com.
This article by Simply Wall St is general in nature. We provide commentary based on historical data and analyst forecasts only using an unbiased methodology and our articles are not intended to be financial advice. It does not constitute a recommendation to buy or sell any stock, and does not take account of your objectives, or your financial situation. We aim to bring you long-term focused analysis driven by fundamental data. Note that our analysis may not factor in the latest price-sensitive company announcements or qualitative material. Simply Wall St has no position in any stocks mentioned.

Simply Wall St
About LSE:ASHM
Flawless balance sheet with proven track record and pays a dividend.
