Stock Analysis

The Tekna Holding ASA (OB:TEKNA) share price has fared very poorly over the last month, falling by a substantial 27%. To make matters worse, the recent drop has wiped out a year's worth of gains with the share price now back where it started a year ago.
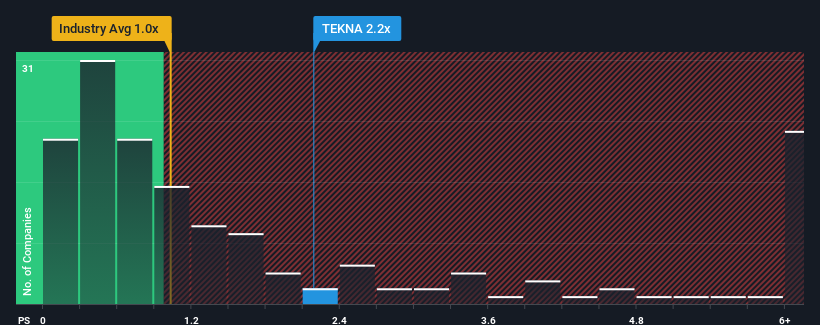
Following the heavy fall in price, Tekna Holding's price-to-sales (or "P/S") ratio of 2.2x might make it look like a strong buy right now compared to the wider Chemicals industry in Norway, where around half of the companies have P/S ratios above 6.4x and even P/S above 23x are quite common. Nonetheless, we'd need to dig a little deeper to determine if there is a rational basis for the highly reduced P/S.
See our latest analysis for Tekna Holding
What Does Tekna Holding's P/S Mean For Shareholders?
Recent times have been quite advantageous for Tekna Holding as its revenue has been rising very briskly. Perhaps the market is expecting future revenue performance to dwindle, which has kept the P/S suppressed. If you like the company, you'd be hoping this isn't the case so that you could potentially pick up some stock while it's out of favour.
We don't have analyst forecasts, but you can see how recent trends are setting up the company for the future by checking out our free report on Tekna Holding's earnings, revenue and cash flow.Do Revenue Forecasts Match The Low P/S Ratio?
Tekna Holding's P/S ratio would be typical for a company that's expected to deliver very poor growth or even falling revenue, and importantly, perform much worse than the industry.
Taking a look back first, we see that the company grew revenue by an impressive 52% last year. Pleasingly, revenue has also lifted 86% in aggregate from three years ago, thanks to the last 12 months of growth. So we can start by confirming that the company has done a great job of growing revenue over that time.
This is in contrast to the rest of the industry, which is expected to grow by 144% over the next year, materially higher than the company's recent medium-term annualised growth rates.
With this in consideration, it's easy to understand why Tekna Holding's P/S falls short of the mark set by its industry peers. Apparently many shareholders weren't comfortable holding on to something they believe will continue to trail the wider industry.
What Does Tekna Holding's P/S Mean For Investors?
Shares in Tekna Holding have plummeted and its P/S has followed suit. It's argued the price-to-sales ratio is an inferior measure of value within certain industries, but it can be a powerful business sentiment indicator.
Our examination of Tekna Holding confirms that the company's revenue trends over the past three-year years are a key factor in its low price-to-sales ratio, as we suspected, given they fall short of current industry expectations. Right now shareholders are accepting the low P/S as they concede future revenue probably won't provide any pleasant surprises. Unless the recent medium-term conditions improve, they will continue to form a barrier for the share price around these levels.
There are also other vital risk factors to consider and we've discovered 3 warning signs for Tekna Holding (2 make us uncomfortable!) that you should be aware of before investing here.
Of course, profitable companies with a history of great earnings growth are generally safer bets. So you may wish to see this free collection of other companies that have reasonable P/E ratios and have grown earnings strongly.
Valuation is complex, but we're helping make it simple.
Find out whether Tekna Holding is potentially over or undervalued by checking out our comprehensive analysis, which includes fair value estimates, risks and warnings, dividends, insider transactions and financial health.
View the Free AnalysisHave feedback on this article? Concerned about the content? Get in touch with us directly. Alternatively, email editorial-team (at) simplywallst.com.
This article by Simply Wall St is general in nature. We provide commentary based on historical data and analyst forecasts only using an unbiased methodology and our articles are not intended to be financial advice. It does not constitute a recommendation to buy or sell any stock, and does not take account of your objectives, or your financial situation. We aim to bring you long-term focused analysis driven by fundamental data. Note that our analysis may not factor in the latest price-sensitive company announcements or qualitative material. Simply Wall St has no position in any stocks mentioned.

Simply Wall St
About OB:TEKNA
Tekna Holding
Tekna Holding ASA develops, manufactures, and sells micro and nano powders, and plasma process solutions in North America, Europe, Asia, and internationally.
Mediocre balance sheet and overvalued.
