Stock Analysis

Glunz & Jensen Holding (CPH:GJ) Full Year 2023 Results
Key Financial Results
- Revenue: kr.143.3m (up 3.4% from FY 2022).
- Net income: kr.2.91m (down 79% from FY 2022).
- Profit margin: 2.0% (down from 10% in FY 2022). The decrease in margin was driven by higher expenses.
- EPS: kr.1.60 (down from kr.7.70 in FY 2022).
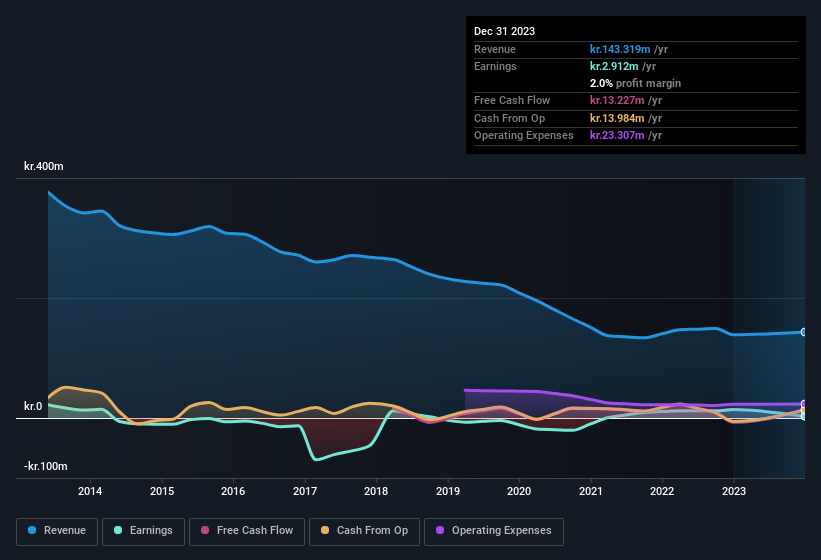
All figures shown in the chart above are for the trailing 12 month (TTM) period
Glunz & Jensen Holding's share price is broadly unchanged from a week ago.
Risk Analysis
You still need to take note of risks, for example - Glunz & Jensen Holding has 3 warning signs (and 1 which is significant) we think you should know about.
Valuation is complex, but we're helping make it simple.
Find out whether Glunz & Jensen Holding is potentially over or undervalued by checking out our comprehensive analysis, which includes fair value estimates, risks and warnings, dividends, insider transactions and financial health.
View the Free AnalysisHave feedback on this article? Concerned about the content? Get in touch with us directly. Alternatively, email editorial-team (at) simplywallst.com.
This article by Simply Wall St is general in nature. We provide commentary based on historical data and analyst forecasts only using an unbiased methodology and our articles are not intended to be financial advice. It does not constitute a recommendation to buy or sell any stock, and does not take account of your objectives, or your financial situation. We aim to bring you long-term focused analysis driven by fundamental data. Note that our analysis may not factor in the latest price-sensitive company announcements or qualitative material. Simply Wall St has no position in any stocks mentioned.

Simply Wall St
About CPSE:GJ
Glunz & Jensen Holding
Glunz & Jensen Holding A/S engages in the development, production, and supply of processors for the offset and flexo printing industry worldwide.
Questionable track record with imperfect balance sheet.
