Stock Analysis
- Brazil
- /
- Consumer Durables
- /
- BOVESPA:GFSA3
Gafisa S.A. (BVMF:GFSA3) Shares May Have Slumped 42% But Getting In Cheap Is Still Unlikely


Unfortunately for some shareholders, the Gafisa S.A. (BVMF:GFSA3) share price has dived 42% in the last thirty days, prolonging recent pain. Indeed, the recent drop has reduced its annual gain to a relatively sedate 3.5% over the last twelve months.
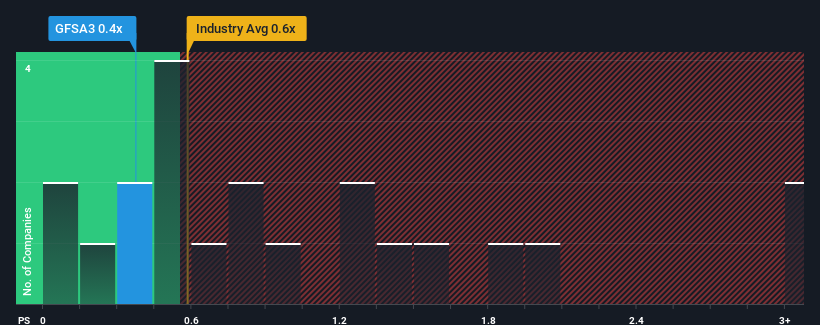
Even after such a large drop in price, it's still not a stretch to say that Gafisa's price-to-sales (or "P/S") ratio of 0.4x right now seems quite "middle-of-the-road" compared to the Consumer Durables industry in Brazil, where the median P/S ratio is around 0.6x. While this might not raise any eyebrows, if the P/S ratio is not justified investors could be missing out on a potential opportunity or ignoring looming disappointment.
Check out our latest analysis for Gafisa
What Does Gafisa's Recent Performance Look Like?
For example, consider that Gafisa's financial performance has been poor lately as its revenue has been in decline. It might be that many expect the company to put the disappointing revenue performance behind them over the coming period, which has kept the P/S from falling. If you like the company, you'd at least be hoping this is the case so that you could potentially pick up some stock while it's not quite in favour.
Want the full picture on earnings, revenue and cash flow for the company? Then our free report on Gafisa will help you shine a light on its historical performance.What Are Revenue Growth Metrics Telling Us About The P/S?
Gafisa's P/S ratio would be typical for a company that's only expected to deliver moderate growth, and importantly, perform in line with the industry.
Taking a look back first, the company's revenue growth last year wasn't something to get excited about as it posted a disappointing decline of 2.9%. Regardless, revenue has managed to lift by a handy 25% in aggregate from three years ago, thanks to the earlier period of growth. So we can start by confirming that the company has generally done a good job of growing revenue over that time, even though it had some hiccups along the way.
Comparing the recent medium-term revenue trends against the industry's one-year growth forecast of 19% shows it's noticeably less attractive.
In light of this, it's curious that Gafisa's P/S sits in line with the majority of other companies. Apparently many investors in the company are less bearish than recent times would indicate and aren't willing to let go of their stock right now. Maintaining these prices will be difficult to achieve as a continuation of recent revenue trends is likely to weigh down the shares eventually.
The Final Word
With its share price dropping off a cliff, the P/S for Gafisa looks to be in line with the rest of the Consumer Durables industry. Typically, we'd caution against reading too much into price-to-sales ratios when settling on investment decisions, though it can reveal plenty about what other market participants think about the company.
We've established that Gafisa's average P/S is a bit surprising since its recent three-year growth is lower than the wider industry forecast. Right now we are uncomfortable with the P/S as this revenue performance isn't likely to support a more positive sentiment for long. If recent medium-term revenue trends continue, the probability of a share price decline will become quite substantial, placing shareholders at risk.
We don't want to rain on the parade too much, but we did also find 3 warning signs for Gafisa (1 shouldn't be ignored!) that you need to be mindful of.
If these risks are making you reconsider your opinion on Gafisa, explore our interactive list of high quality stocks to get an idea of what else is out there.
Valuation is complex, but we're helping make it simple.
Find out whether Gafisa is potentially over or undervalued by checking out our comprehensive analysis, which includes fair value estimates, risks and warnings, dividends, insider transactions and financial health.
View the Free AnalysisHave feedback on this article? Concerned about the content? Get in touch with us directly. Alternatively, email editorial-team (at) simplywallst.com.
This article by Simply Wall St is general in nature. We provide commentary based on historical data and analyst forecasts only using an unbiased methodology and our articles are not intended to be financial advice. It does not constitute a recommendation to buy or sell any stock, and does not take account of your objectives, or your financial situation. We aim to bring you long-term focused analysis driven by fundamental data. Note that our analysis may not factor in the latest price-sensitive company announcements or qualitative material. Simply Wall St has no position in any stocks mentioned.
About BOVESPA:GFSA3
Gafisa
Gafisa S.A. operates as a development and construction company under the Gafisa brand name in Brazil.
Excellent balance sheet and slightly overvalued.
