Stock Analysis
- India
- /
- Real Estate
- /
- NSEI:VIPULLTD
Further Upside For Vipul Limited (NSE:VIPULLTD) Shares Could Introduce Price Risks After 27% Bounce


Despite an already strong run, Vipul Limited (NSE:VIPULLTD) shares have been powering on, with a gain of 27% in the last thirty days. The annual gain comes to 127% following the latest surge, making investors sit up and take notice.
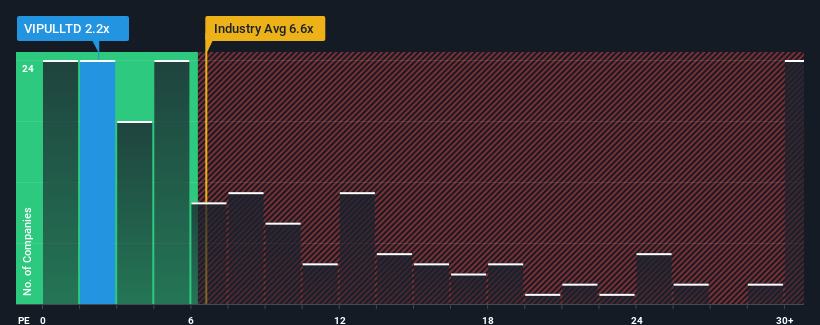
Even after such a large jump in price, Vipul may still look like a strong buying opportunity at present with its price-to-sales (or "P/S") ratio of 2.2x, considering almost half of all companies in the Real Estate industry in India have P/S ratios greater than 6.6x and even P/S higher than 19x aren't out of the ordinary. Although, it's not wise to just take the P/S at face value as there may be an explanation why it's so limited.
View our latest analysis for Vipul
What Does Vipul's P/S Mean For Shareholders?
Recent times have been quite advantageous for Vipul as its revenue has been rising very briskly. Perhaps the market is expecting future revenue performance to dwindle, which has kept the P/S suppressed. If that doesn't eventuate, then existing shareholders have reason to be quite optimistic about the future direction of the share price.
We don't have analyst forecasts, but you can see how recent trends are setting up the company for the future by checking out our free report on Vipul's earnings, revenue and cash flow.Do Revenue Forecasts Match The Low P/S Ratio?
In order to justify its P/S ratio, Vipul would need to produce anemic growth that's substantially trailing the industry.
Retrospectively, the last year delivered an exceptional 91% gain to the company's top line. Spectacularly, three year revenue growth has ballooned by several orders of magnitude, thanks in part to the last 12 months of revenue growth. Accordingly, shareholders would have been over the moon with those medium-term rates of revenue growth.
This is in contrast to the rest of the industry, which is expected to grow by 40% over the next year, materially lower than the company's recent medium-term annualised growth rates.
With this in mind, we find it intriguing that Vipul's P/S isn't as high compared to that of its industry peers. It looks like most investors are not convinced the company can maintain its recent growth rates.
The Final Word
Vipul's recent share price jump still sees fails to bring its P/S alongside the industry median. Using the price-to-sales ratio alone to determine if you should sell your stock isn't sensible, however it can be a practical guide to the company's future prospects.
We're very surprised to see Vipul currently trading on a much lower than expected P/S since its recent three-year growth is higher than the wider industry forecast. Potential investors that are sceptical over continued revenue performance may be preventing the P/S ratio from matching previous strong performance. At least price risks look to be very low if recent medium-term revenue trends continue, but investors seem to think future revenue could see a lot of volatility.
It is also worth noting that we have found 2 warning signs for Vipul (1 shouldn't be ignored!) that you need to take into consideration.
If strong companies turning a profit tickle your fancy, then you'll want to check out this free list of interesting companies that trade on a low P/E (but have proven they can grow earnings).
Valuation is complex, but we're helping make it simple.
Find out whether Vipul is potentially over or undervalued by checking out our comprehensive analysis, which includes fair value estimates, risks and warnings, dividends, insider transactions and financial health.
View the Free AnalysisHave feedback on this article? Concerned about the content? Get in touch with us directly. Alternatively, email editorial-team (at) simplywallst.com.
This article by Simply Wall St is general in nature. We provide commentary based on historical data and analyst forecasts only using an unbiased methodology and our articles are not intended to be financial advice. It does not constitute a recommendation to buy or sell any stock, and does not take account of your objectives, or your financial situation. We aim to bring you long-term focused analysis driven by fundamental data. Note that our analysis may not factor in the latest price-sensitive company announcements or qualitative material. Simply Wall St has no position in any stocks mentioned.
About NSEI:VIPULLTD
Vipul
Vipul Limited engages in real estate development and services business in India.
Good value with acceptable track record.
