Stock Analysis
- Finland
- /
- Electric Utilities
- /
- HLSE:FORTUM
Fortum Oyj (HEL:FORTUM) shareholders have endured a 32% loss from investing in the stock three years ago


In order to justify the effort of selecting individual stocks, it's worth striving to beat the returns from a market index fund. But its virtually certain that sometimes you will buy stocks that fall short of the market average returns. We regret to report that long term Fortum Oyj (HEL:FORTUM) shareholders have had that experience, with the share price dropping 47% in three years, versus a market decline of about 14%.
With that in mind, it's worth seeing if the company's underlying fundamentals have been the driver of long term performance, or if there are some discrepancies.
Check out our latest analysis for Fortum Oyj
There is no denying that markets are sometimes efficient, but prices do not always reflect underlying business performance. By comparing earnings per share (EPS) and share price changes over time, we can get a feel for how investor attitudes to a company have morphed over time.
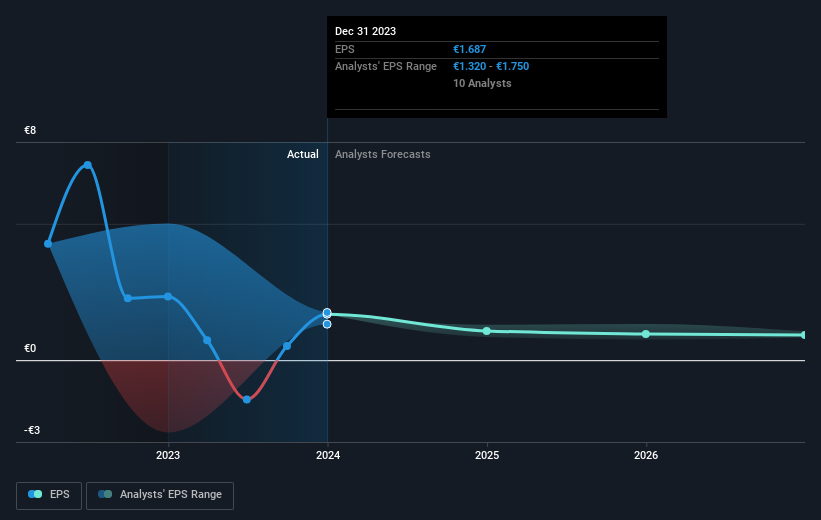
Fortum Oyj saw its EPS decline at a compound rate of 6.3% per year, over the last three years. The share price decline of 19% is actually steeper than the EPS slippage. So it seems the market was too confident about the business, in the past. The less favorable sentiment is reflected in its current P/E ratio of 7.14.
You can see how EPS has changed over time in the image below (click on the chart to see the exact values).
This free interactive report on Fortum Oyj's earnings, revenue and cash flow is a great place to start, if you want to investigate the stock further.
What About Dividends?
As well as measuring the share price return, investors should also consider the total shareholder return (TSR). The TSR incorporates the value of any spin-offs or discounted capital raisings, along with any dividends, based on the assumption that the dividends are reinvested. It's fair to say that the TSR gives a more complete picture for stocks that pay a dividend. As it happens, Fortum Oyj's TSR for the last 3 years was -32%, which exceeds the share price return mentioned earlier. The dividends paid by the company have thusly boosted the total shareholder return.
A Different Perspective
While it's never nice to take a loss, Fortum Oyj shareholders can take comfort that , including dividends,their trailing twelve month loss of 5.0% wasn't as bad as the market loss of around 8.7%. Unfortunately, last year's performance may indicate unresolved challenges, given that it's worse than the annualised loss of 2% over the last half decade. Whilst Baron Rothschild does tell the investor "buy when there's blood in the streets, even if the blood is your own", buyers would need to examine the data carefully to be comfortable that the business itself is sound. I find it very interesting to look at share price over the long term as a proxy for business performance. But to truly gain insight, we need to consider other information, too. For instance, we've identified 2 warning signs for Fortum Oyj (1 is potentially serious) that you should be aware of.
But note: Fortum Oyj may not be the best stock to buy. So take a peek at this free list of interesting companies with past earnings growth (and further growth forecast).
Please note, the market returns quoted in this article reflect the market weighted average returns of stocks that currently trade on Finnish exchanges.
Valuation is complex, but we're helping make it simple.
Find out whether Fortum Oyj is potentially over or undervalued by checking out our comprehensive analysis, which includes fair value estimates, risks and warnings, dividends, insider transactions and financial health.
View the Free AnalysisHave feedback on this article? Concerned about the content? Get in touch with us directly. Alternatively, email editorial-team (at) simplywallst.com.
This article by Simply Wall St is general in nature. We provide commentary based on historical data and analyst forecasts only using an unbiased methodology and our articles are not intended to be financial advice. It does not constitute a recommendation to buy or sell any stock, and does not take account of your objectives, or your financial situation. We aim to bring you long-term focused analysis driven by fundamental data. Note that our analysis may not factor in the latest price-sensitive company announcements or qualitative material. Simply Wall St has no position in any stocks mentioned.
About HLSE:FORTUM
Fortum Oyj
Fortum Oyj, together with its subsidiaries, engages in the generation and sale of electricity and heat in the Nordic countries, Sweden, Germany, the United Kingdom, the Netherlands, and internationally.
Excellent balance sheet established dividend payer.
