Stock Analysis
- South Korea
- /
- Semiconductors
- /
- KOSDAQ:A039440
Estimating The Intrinsic Value Of STI Co., Ltd. (KOSDAQ:039440)
Key Insights
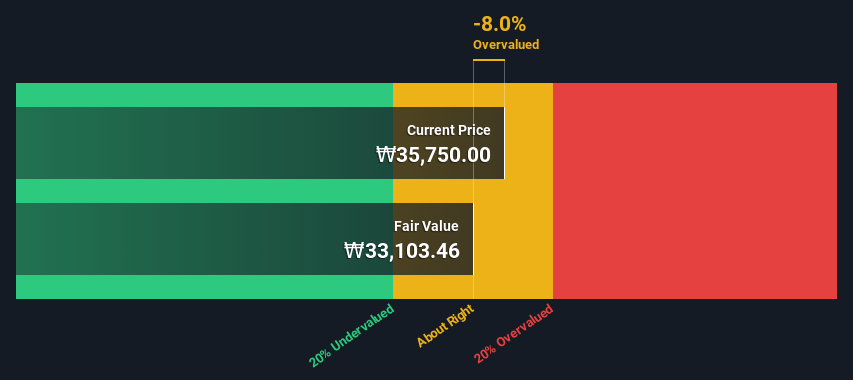
- The projected fair value for STI is ₩33,103 based on 2 Stage Free Cash Flow to Equity
- STI's ₩35,750 share price indicates it is trading at similar levels as its fair value estimate
- Analyst price target for A039440 is ₩51,667, which is 56% above our fair value estimate
Today we'll do a simple run through of a valuation method used to estimate the attractiveness of STI Co., Ltd. (KOSDAQ:039440) as an investment opportunity by taking the expected future cash flows and discounting them to their present value. This will be done using the Discounted Cash Flow (DCF) model. Models like these may appear beyond the comprehension of a lay person, but they're fairly easy to follow.
Remember though, that there are many ways to estimate a company's value, and a DCF is just one method. For those who are keen learners of equity analysis, the Simply Wall St analysis model here may be something of interest to you.
Check out our latest analysis for STI
Is STI Fairly Valued?
We're using the 2-stage growth model, which simply means we take in account two stages of company's growth. In the initial period the company may have a higher growth rate and the second stage is usually assumed to have a stable growth rate. In the first stage we need to estimate the cash flows to the business over the next ten years. Where possible we use analyst estimates, but when these aren't available we extrapolate the previous free cash flow (FCF) from the last estimate or reported value. We assume companies with shrinking free cash flow will slow their rate of shrinkage, and that companies with growing free cash flow will see their growth rate slow, over this period. We do this to reflect that growth tends to slow more in the early years than it does in later years.
Generally we assume that a dollar today is more valuable than a dollar in the future, and so the sum of these future cash flows is then discounted to today's value:
10-year free cash flow (FCF) forecast
| 2024 | 2025 | 2026 | 2027 | 2028 | 2029 | 2030 | 2031 | 2032 | 2033 | |
| Levered FCF (₩, Millions) | ₩18.4b | ₩50.6b | ₩45.4b | ₩42.5b | ₩40.9b | ₩40.1b | ₩39.9b | ₩40.0b | ₩40.4b | ₩40.9b |
| Growth Rate Estimate Source | Analyst x2 | Analyst x2 | Est @ -10.19% | Est @ -6.41% | Est @ -3.76% | Est @ -1.91% | Est @ -0.61% | Est @ 0.29% | Est @ 0.93% | Est @ 1.37% |
| Present Value (₩, Millions) Discounted @ 9.5% | ₩16.8k | ₩42.2k | ₩34.6k | ₩29.6k | ₩26.0k | ₩23.3k | ₩21.2k | ₩19.4k | ₩17.9k | ₩16.6k |
("Est" = FCF growth rate estimated by Simply Wall St)
Present Value of 10-year Cash Flow (PVCF) = ₩248b
We now need to calculate the Terminal Value, which accounts for all the future cash flows after this ten year period. For a number of reasons a very conservative growth rate is used that cannot exceed that of a country's GDP growth. In this case we have used the 5-year average of the 10-year government bond yield (2.4%) to estimate future growth. In the same way as with the 10-year 'growth' period, we discount future cash flows to today's value, using a cost of equity of 9.5%.
Terminal Value (TV)= FCF2033 × (1 + g) ÷ (r – g) = ₩41b× (1 + 2.4%) ÷ (9.5%– 2.4%) = ₩594b
Present Value of Terminal Value (PVTV)= TV / (1 + r)10= ₩594b÷ ( 1 + 9.5%)10= ₩240b
The total value is the sum of cash flows for the next ten years plus the discounted terminal value, which results in the Total Equity Value, which in this case is ₩488b. To get the intrinsic value per share, we divide this by the total number of shares outstanding. Relative to the current share price of ₩36k, the company appears around fair value at the time of writing. Valuations are imprecise instruments though, rather like a telescope - move a few degrees and end up in a different galaxy. Do keep this in mind.
The Assumptions
Now the most important inputs to a discounted cash flow are the discount rate, and of course, the actual cash flows. Part of investing is coming up with your own evaluation of a company's future performance, so try the calculation yourself and check your own assumptions. The DCF also does not consider the possible cyclicality of an industry, or a company's future capital requirements, so it does not give a full picture of a company's potential performance. Given that we are looking at STI as potential shareholders, the cost of equity is used as the discount rate, rather than the cost of capital (or weighted average cost of capital, WACC) which accounts for debt. In this calculation we've used 9.5%, which is based on a levered beta of 1.326. Beta is a measure of a stock's volatility, compared to the market as a whole. We get our beta from the industry average beta of globally comparable companies, with an imposed limit between 0.8 and 2.0, which is a reasonable range for a stable business.
SWOT Analysis for STI
- Debt is not viewed as a risk.
- Dividends are covered by earnings and cash flows.
- Earnings declined over the past year.
- Dividend is low compared to the top 25% of dividend payers in the Semiconductor market.
- Annual earnings are forecast to grow faster than the South Korean market.
- Good value based on P/E ratio compared to estimated Fair P/E ratio.
- No apparent threats visible for A039440.
Moving On:
Although the valuation of a company is important, it is only one of many factors that you need to assess for a company. The DCF model is not a perfect stock valuation tool. Rather it should be seen as a guide to "what assumptions need to be true for this stock to be under/overvalued?" For instance, if the terminal value growth rate is adjusted slightly, it can dramatically alter the overall result. For STI, we've put together three important factors you should explore:
- Risks: Case in point, we've spotted 1 warning sign for STI you should be aware of.
- Future Earnings: How does A039440's growth rate compare to its peers and the wider market? Dig deeper into the analyst consensus number for the upcoming years by interacting with our free analyst growth expectation chart.
- Other High Quality Alternatives: Do you like a good all-rounder? Explore our interactive list of high quality stocks to get an idea of what else is out there you may be missing!
PS. The Simply Wall St app conducts a discounted cash flow valuation for every stock on the KOSDAQ every day. If you want to find the calculation for other stocks just search here.
Valuation is complex, but we're helping make it simple.
Find out whether STI is potentially over or undervalued by checking out our comprehensive analysis, which includes fair value estimates, risks and warnings, dividends, insider transactions and financial health.
View the Free AnalysisHave feedback on this article? Concerned about the content? Get in touch with us directly. Alternatively, email editorial-team (at) simplywallst.com.
This article by Simply Wall St is general in nature. We provide commentary based on historical data and analyst forecasts only using an unbiased methodology and our articles are not intended to be financial advice. It does not constitute a recommendation to buy or sell any stock, and does not take account of your objectives, or your financial situation. We aim to bring you long-term focused analysis driven by fundamental data. Note that our analysis may not factor in the latest price-sensitive company announcements or qualitative material. Simply Wall St has no position in any stocks mentioned.

Simply Wall St
About KOSDAQ:A039440
STI
STI Co., Ltd. operates in the semiconductor equipment industry in Korea.
Flawless balance sheet with high growth potential.
