Stock Analysis


Key Insights
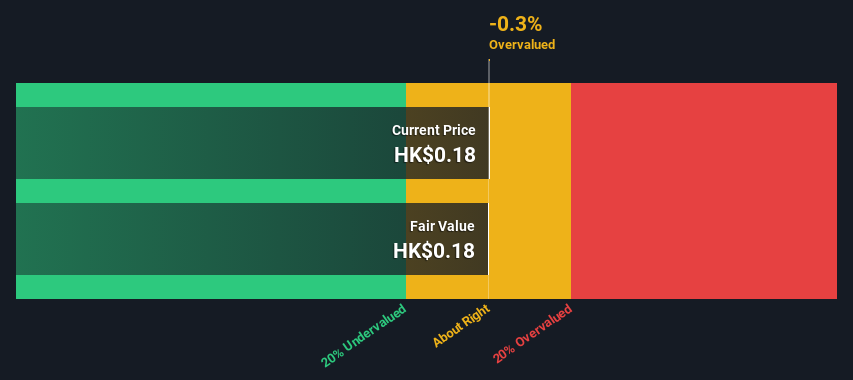
- Using the 2 Stage Free Cash Flow to Equity, Tai Kam Holdings fair value estimate is HK$0.18
- Current share price of HK$0.18 suggests Tai Kam Holdings is potentially trading close to its fair value
- Tai Kam Holdings' peers seem to be trading at a higher premium to fair value based onthe industry average of -95%
Today we'll do a simple run through of a valuation method used to estimate the attractiveness of Tai Kam Holdings Limited (HKG:8321) as an investment opportunity by estimating the company's future cash flows and discounting them to their present value. Our analysis will employ the Discounted Cash Flow (DCF) model. It may sound complicated, but actually it is quite simple!
We generally believe that a company's value is the present value of all of the cash it will generate in the future. However, a DCF is just one valuation metric among many, and it is not without flaws. If you want to learn more about discounted cash flow, the rationale behind this calculation can be read in detail in the Simply Wall St analysis model.
View our latest analysis for Tai Kam Holdings
The Model
We use what is known as a 2-stage model, which simply means we have two different periods of growth rates for the company's cash flows. Generally the first stage is higher growth, and the second stage is a lower growth phase. To start off with, we need to estimate the next ten years of cash flows. Seeing as no analyst estimates of free cash flow are available to us, we have extrapolate the previous free cash flow (FCF) from the company's last reported value. We assume companies with shrinking free cash flow will slow their rate of shrinkage, and that companies with growing free cash flow will see their growth rate slow, over this period. We do this to reflect that growth tends to slow more in the early years than it does in later years.
Generally we assume that a dollar today is more valuable than a dollar in the future, and so the sum of these future cash flows is then discounted to today's value:
10-year free cash flow (FCF) estimate
| 2024 | 2025 | 2026 | 2027 | 2028 | 2029 | 2030 | 2031 | 2032 | 2033 | |
| Levered FCF (HK$, Millions) | HK$673.2k | HK$1.04m | HK$1.45m | HK$1.86m | HK$2.23m | HK$2.56m | HK$2.84m | HK$3.07m | HK$3.27m | HK$3.44m |
| Growth Rate Estimate Source | Est @ 77.62% | Est @ 54.95% | Est @ 39.08% | Est @ 27.96% | Est @ 20.19% | Est @ 14.74% | Est @ 10.93% | Est @ 8.26% | Est @ 6.40% | Est @ 5.09% |
| Present Value (HK$, Millions) Discounted @ 7.6% | HK$0.6 | HK$0.9 | HK$1.2 | HK$1.4 | HK$1.5 | HK$1.6 | HK$1.7 | HK$1.7 | HK$1.7 | HK$1.7 |
("Est" = FCF growth rate estimated by Simply Wall St)
Present Value of 10-year Cash Flow (PVCF) = HK$14m
The second stage is also known as Terminal Value, this is the business's cash flow after the first stage. For a number of reasons a very conservative growth rate is used that cannot exceed that of a country's GDP growth. In this case we have used the 5-year average of the 10-year government bond yield (2.0%) to estimate future growth. In the same way as with the 10-year 'growth' period, we discount future cash flows to today's value, using a cost of equity of 7.6%.
Terminal Value (TV)= FCF2033 × (1 + g) ÷ (r – g) = HK$3.4m× (1 + 2.0%) ÷ (7.6%– 2.0%) = HK$63m
Present Value of Terminal Value (PVTV)= TV / (1 + r)10= HK$63m÷ ( 1 + 7.6%)10= HK$30m
The total value is the sum of cash flows for the next ten years plus the discounted terminal value, which results in the Total Equity Value, which in this case is HK$44m. To get the intrinsic value per share, we divide this by the total number of shares outstanding. Relative to the current share price of HK$0.2, the company appears around fair value at the time of writing. Valuations are imprecise instruments though, rather like a telescope - move a few degrees and end up in a different galaxy. Do keep this in mind.
The Assumptions
We would point out that the most important inputs to a discounted cash flow are the discount rate and of course the actual cash flows. If you don't agree with these result, have a go at the calculation yourself and play with the assumptions. The DCF also does not consider the possible cyclicality of an industry, or a company's future capital requirements, so it does not give a full picture of a company's potential performance. Given that we are looking at Tai Kam Holdings as potential shareholders, the cost of equity is used as the discount rate, rather than the cost of capital (or weighted average cost of capital, WACC) which accounts for debt. In this calculation we've used 7.6%, which is based on a levered beta of 1.018. Beta is a measure of a stock's volatility, compared to the market as a whole. We get our beta from the industry average beta of globally comparable companies, with an imposed limit between 0.8 and 2.0, which is a reasonable range for a stable business.
SWOT Analysis for Tai Kam Holdings
- Currently debt free.
- Current share price is above our estimate of fair value.
- Has sufficient cash runway for more than 3 years based on current free cash flows.
- Lack of analyst coverage makes it difficult to determine 8321's earnings prospects.
- No apparent threats visible for 8321.
Looking Ahead:
Although the valuation of a company is important, it shouldn't be the only metric you look at when researching a company. It's not possible to obtain a foolproof valuation with a DCF model. Instead the best use for a DCF model is to test certain assumptions and theories to see if they would lead to the company being undervalued or overvalued. If a company grows at a different rate, or if its cost of equity or risk free rate changes sharply, the output can look very different. For Tai Kam Holdings, we've put together three essential aspects you should explore:
- Risks: Consider for instance, the ever-present spectre of investment risk. We've identified 2 warning signs with Tai Kam Holdings , and understanding them should be part of your investment process.
- Other High Quality Alternatives: Do you like a good all-rounder? Explore our interactive list of high quality stocks to get an idea of what else is out there you may be missing!
- Other Top Analyst Picks: Interested to see what the analysts are thinking? Take a look at our interactive list of analysts' top stock picks to find out what they feel might have an attractive future outlook!
PS. Simply Wall St updates its DCF calculation for every Hong Kong stock every day, so if you want to find the intrinsic value of any other stock just search here.
Valuation is complex, but we're helping make it simple.
Find out whether Tai Kam Holdings is potentially over or undervalued by checking out our comprehensive analysis, which includes fair value estimates, risks and warnings, dividends, insider transactions and financial health.
View the Free AnalysisHave feedback on this article? Concerned about the content? Get in touch with us directly. Alternatively, email editorial-team (at) simplywallst.com.
This article by Simply Wall St is general in nature. We provide commentary based on historical data and analyst forecasts only using an unbiased methodology and our articles are not intended to be financial advice. It does not constitute a recommendation to buy or sell any stock, and does not take account of your objectives, or your financial situation. We aim to bring you long-term focused analysis driven by fundamental data. Note that our analysis may not factor in the latest price-sensitive company announcements or qualitative material. Simply Wall St has no position in any stocks mentioned.
About SEHK:8321
Tai Kam Holdings
Tai Kam Holdings Limited, an investment holding company, undertakes site formation works and renovation works in Hong Kong.
Flawless balance sheet with weak fundamentals.
