Stock Analysis
- Hong Kong
- /
- Construction
- /
- SEHK:3928
Estimating The Fair Value Of S&T Holdings Limited (HKG:3928)

Key Insights
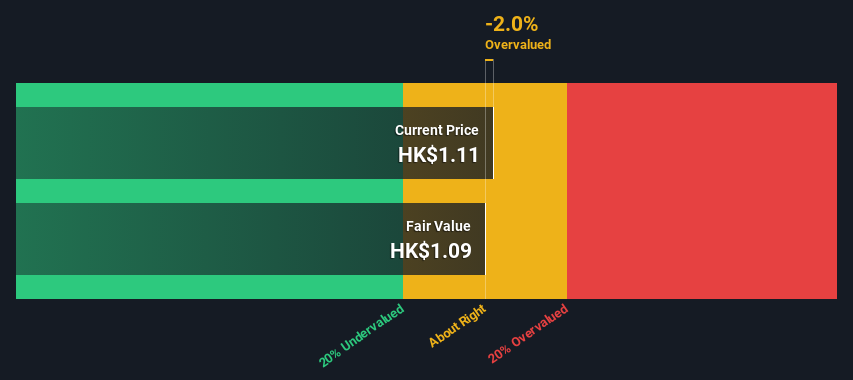
- S&T Holdings' estimated fair value is HK$1.09 based on 2 Stage Free Cash Flow to Equity
- S&T Holdings' HK$1.11 share price indicates it is trading at similar levels as its fair value estimate
- Industry average of 91% suggests S&T Holdings' peers are currently trading at a higher premium to fair value
Does the April share price for S&T Holdings Limited (HKG:3928) reflect what it's really worth? Today, we will estimate the stock's intrinsic value by taking the expected future cash flows and discounting them to today's value. One way to achieve this is by employing the Discounted Cash Flow (DCF) model. Before you think you won't be able to understand it, just read on! It's actually much less complex than you'd imagine.
Companies can be valued in a lot of ways, so we would point out that a DCF is not perfect for every situation. If you still have some burning questions about this type of valuation, take a look at the Simply Wall St analysis model.
View our latest analysis for S&T Holdings
Step By Step Through The Calculation
We use what is known as a 2-stage model, which simply means we have two different periods of growth rates for the company's cash flows. Generally the first stage is higher growth, and the second stage is a lower growth phase. To start off with, we need to estimate the next ten years of cash flows. Seeing as no analyst estimates of free cash flow are available to us, we have extrapolate the previous free cash flow (FCF) from the company's last reported value. We assume companies with shrinking free cash flow will slow their rate of shrinkage, and that companies with growing free cash flow will see their growth rate slow, over this period. We do this to reflect that growth tends to slow more in the early years than it does in later years.
Generally we assume that a dollar today is more valuable than a dollar in the future, so we discount the value of these future cash flows to their estimated value in today's dollars:
10-year free cash flow (FCF) estimate
| 2024 | 2025 | 2026 | 2027 | 2028 | 2029 | 2030 | 2031 | 2032 | 2033 | |
| Levered FCF (SGD, Millions) | S$2.96m | S$3.54m | S$4.04m | S$4.47m | S$4.83m | S$5.14m | S$5.39m | S$5.61m | S$5.81m | S$5.99m |
| Growth Rate Estimate Source | Est @ 27.08% | Est @ 19.57% | Est @ 14.31% | Est @ 10.63% | Est @ 8.05% | Est @ 6.25% | Est @ 4.99% | Est @ 4.10% | Est @ 3.48% | Est @ 3.05% |
| Present Value (SGD, Millions) Discounted @ 7.2% | S$2.8 | S$3.1 | S$3.3 | S$3.4 | S$3.4 | S$3.4 | S$3.3 | S$3.2 | S$3.1 | S$3.0 |
("Est" = FCF growth rate estimated by Simply Wall St)
Present Value of 10-year Cash Flow (PVCF) = S$32m
After calculating the present value of future cash flows in the initial 10-year period, we need to calculate the Terminal Value, which accounts for all future cash flows beyond the first stage. The Gordon Growth formula is used to calculate Terminal Value at a future annual growth rate equal to the 5-year average of the 10-year government bond yield of 2.0%. We discount the terminal cash flows to today's value at a cost of equity of 7.2%.
Terminal Value (TV)= FCF2033 × (1 + g) ÷ (r – g) = S$6.0m× (1 + 2.0%) ÷ (7.2%– 2.0%) = S$119m
Present Value of Terminal Value (PVTV)= TV / (1 + r)10= S$119m÷ ( 1 + 7.2%)10= S$59m
The total value is the sum of cash flows for the next ten years plus the discounted terminal value, which results in the Total Equity Value, which in this case is S$91m. To get the intrinsic value per share, we divide this by the total number of shares outstanding. Compared to the current share price of HK$1.1, the company appears around fair value at the time of writing. The assumptions in any calculation have a big impact on the valuation, so it is better to view this as a rough estimate, not precise down to the last cent.
Important Assumptions
Now the most important inputs to a discounted cash flow are the discount rate, and of course, the actual cash flows. Part of investing is coming up with your own evaluation of a company's future performance, so try the calculation yourself and check your own assumptions. The DCF also does not consider the possible cyclicality of an industry, or a company's future capital requirements, so it does not give a full picture of a company's potential performance. Given that we are looking at S&T Holdings as potential shareholders, the cost of equity is used as the discount rate, rather than the cost of capital (or weighted average cost of capital, WACC) which accounts for debt. In this calculation we've used 7.2%, which is based on a levered beta of 1.120. Beta is a measure of a stock's volatility, compared to the market as a whole. We get our beta from the industry average beta of globally comparable companies, with an imposed limit between 0.8 and 2.0, which is a reasonable range for a stable business.
SWOT Analysis for S&T Holdings
- Net debt to equity ratio below 40%.
- Current share price is above our estimate of fair value.
- Has sufficient cash runway for more than 3 years based on current free cash flows.
- Lack of analyst coverage makes it difficult to determine 3928's earnings prospects.
- Debt is not well covered by operating cash flow.
Next Steps:
Although the valuation of a company is important, it ideally won't be the sole piece of analysis you scrutinize for a company. It's not possible to obtain a foolproof valuation with a DCF model. Instead the best use for a DCF model is to test certain assumptions and theories to see if they would lead to the company being undervalued or overvalued. For example, changes in the company's cost of equity or the risk free rate can significantly impact the valuation. For S&T Holdings, we've put together three additional factors you should consider:
- Risks: Every company has them, and we've spotted 2 warning signs for S&T Holdings (of which 1 doesn't sit too well with us!) you should know about.
- Other Solid Businesses: Low debt, high returns on equity and good past performance are fundamental to a strong business. Why not explore our interactive list of stocks with solid business fundamentals to see if there are other companies you may not have considered!
- Other Environmentally-Friendly Companies: Concerned about the environment and think consumers will buy eco-friendly products more and more? Browse through our interactive list of companies that are thinking about a greener future to discover some stocks you may not have thought of!
PS. The Simply Wall St app conducts a discounted cash flow valuation for every stock on the SEHK every day. If you want to find the calculation for other stocks just search here.
Valuation is complex, but we're helping make it simple.
Find out whether S&T Holdings is potentially over or undervalued by checking out our comprehensive analysis, which includes fair value estimates, risks and warnings, dividends, insider transactions and financial health.
View the Free AnalysisHave feedback on this article? Concerned about the content? Get in touch with us directly. Alternatively, email editorial-team (at) simplywallst.com.
This article by Simply Wall St is general in nature. We provide commentary based on historical data and analyst forecasts only using an unbiased methodology and our articles are not intended to be financial advice. It does not constitute a recommendation to buy or sell any stock, and does not take account of your objectives, or your financial situation. We aim to bring you long-term focused analysis driven by fundamental data. Note that our analysis may not factor in the latest price-sensitive company announcements or qualitative material. Simply Wall St has no position in any stocks mentioned.

Simply Wall St
About SEHK:3928
S&T Holdings
S&T Holdings Limited, an investment holding company, engages in the construction services and property investment business in Singapore.
Flawless balance sheet with weak fundamentals.
